Comparing Meta Platforms With Industry Competitors In Interactive Media & Services Industry
Author: Benzinga Insights | October 10, 2025 11:00am
Amidst the fast-paced and highly competitive business environment of today, conducting comprehensive company analysis is essential for investors and industry enthusiasts. In this article, we will delve into an extensive industry comparison, evaluating Meta Platforms (NASDAQ:META) in comparison to its major competitors within the Interactive Media & Services industry. By analyzing critical financial metrics, market position, and growth potential, our objective is to provide valuable insights for investors and offer a deeper understanding of company's performance in the industry.
Meta Platforms Background
Meta is the largest social media company in the world, boasting close to 4 billion monthly active users worldwide. The firm's "Family of Apps," its core business, consists of Facebook, Instagram, Messenger, and WhatsApp. End users can leverage these applications for a variety of different purposes, from keeping in touch with friends to following celebrities and running digital businesses for free. Meta packages customer data, gleaned from its application ecosystem and sells ads to digital advertisers. While the firm has been investing heavily in its Reality Labs business, it remains a very small part of Meta's overall sales.
| Company |
P/E |
P/B |
P/S |
ROE |
EBITDA (in billions) |
Gross Profit (in billions) |
Revenue Growth |
| Meta Platforms Inc |
26.62 |
9.45 |
10.64 |
9.65% |
$25.12 |
$39.02 |
21.61% |
| Alphabet Inc |
25.75 |
8.05 |
8.01 |
7.96% |
$39.19 |
$57.39 |
13.79% |
| Baidu Inc |
12.10 |
1.18 |
2.45 |
2.69% |
$8.84 |
$14.36 |
-3.59% |
| Reddit Inc |
94.51 |
16.60 |
22.68 |
3.88% |
$0.07 |
$0.45 |
77.69% |
| Pinterest Inc |
11.55 |
4.50 |
5.73 |
0.82% |
$0.0 |
$0.8 |
16.93% |
| Bilibili Inc |
394.29 |
6.10 |
3.02 |
1.53% |
$0.81 |
$2.68 |
19.76% |
| Trump Media & Technology Group Corp |
189.67 |
2.09 |
1013.21 |
-1.26% |
$-0.01 |
$0.0 |
5.54% |
| CarGurus Inc |
27.19 |
7.75 |
3.88 |
5.34% |
$0.06 |
$0.2 |
7.01% |
| ZoomInfo Technologies Inc |
41.76 |
2.14 |
2.91 |
1.5% |
$0.09 |
$0.26 |
5.21% |
| Weibo Corp |
8.77 |
0.84 |
1.87 |
3.58% |
$0.15 |
$0.34 |
1.58% |
| Yelp Inc |
14.30 |
2.63 |
1.46 |
5.98% |
$0.07 |
$0.33 |
3.75% |
| Tripadvisor Inc |
32.19 |
2.86 |
1.20 |
5.67% |
$0.09 |
$0.49 |
6.44% |
| Ziff Davis Inc |
24.04 |
0.85 |
1.12 |
1.44% |
$0.09 |
$0.3 |
9.79% |
| FuboTV Inc |
20.16 |
3.19 |
0.87 |
-1.98% |
$0.01 |
$0.08 |
-2.81% |
| Yalla Group Ltd |
9.10 |
1.56 |
3.86 |
4.96% |
$0.03 |
$0.06 |
4.15% |
| Average |
64.67 |
4.31 |
76.59 |
3.01% |
$3.54 |
$5.55 |
11.8% |
Upon closer analysis of Meta Platforms, the following trends become apparent:
-
The Price to Earnings ratio of 26.62 is 0.41x lower than the industry average, indicating potential undervaluation for the stock.
-
The elevated Price to Book ratio of 9.45 relative to the industry average by 2.19x suggests company might be overvalued based on its book value.
-
The Price to Sales ratio is 10.64, which is 0.14x the industry average. This suggests a possible undervaluation based on sales performance.
-
The Return on Equity (ROE) of 9.65% is 6.64% above the industry average, highlighting efficient use of equity to generate profits.
-
The Earnings Before Interest, Taxes, Depreciation, and Amortization (EBITDA) of $25.12 Billion is 7.1x above the industry average, highlighting stronger profitability and robust cash flow generation.
-
With higher gross profit of $39.02 Billion, which indicates 7.03x above the industry average, the company demonstrates stronger profitability and higher earnings from its core operations.
-
The company's revenue growth of 21.61% is notably higher compared to the industry average of 11.8%, showcasing exceptional sales performance and strong demand for its products or services.
Debt To Equity Ratio
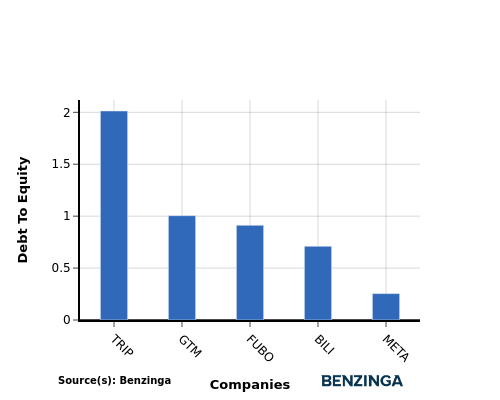
The debt-to-equity (D/E) ratio assesses the extent to which a company relies on borrowed funds compared to its equity.
Considering the debt-to-equity ratio in industry comparisons allows for a concise evaluation of a company's financial health and risk profile, aiding in informed decision-making.
By analyzing Meta Platforms in relation to its top 4 peers based on the Debt-to-Equity ratio, the following insights can be derived:
-
Meta Platforms is in a relatively stronger financial position compared to its top 4 peers, as evidenced by its lower debt-to-equity ratio of 0.25.
-
This implies that the company relies less on debt financing and has a more favorable balance between debt and equity.
Key Takeaways
For Meta Platforms, the PE ratio is low compared to peers, indicating potential undervaluation. The high PB ratio suggests the market values the company's assets highly. A low PS ratio implies sales are generating strong value. The high ROE, EBITDA, gross profit, and revenue growth indicate strong financial performance relative to industry peers.
This article was generated by Benzinga's automated content engine and reviewed by an editor.
Posted In: META


