Competitor Analysis: Evaluating NVIDIA And Competitors In Semiconductors & Semiconductor Equipment Industry
Author: Benzinga Insights | October 13, 2025 11:00am
Amidst today's fast-paced and highly competitive business environment, it is crucial for investors and industry enthusiasts to conduct comprehensive company evaluations. In this article, we will delve into an extensive industry comparison, evaluating NVIDIA (NASDAQ:NVDA) in comparison to its major competitors within the Semiconductors & Semiconductor Equipment industry. By analyzing critical financial metrics, market position, and growth potential, our objective is to provide valuable insights for investors and offer a deeper understanding of company's performance in the industry.
NVIDIA Background
Nvidia is a leading developer of graphics processing units. Traditionally, GPUs were used to enhance the experience on computing platforms, most notably in gaming applications on PCs. GPU use cases have since emerged as important semiconductors used in artificial intelligence to run large language models. Nvidia not only offers AI GPUs, but also a software platform, Cuda, used for AI model development and training. Nvidia is also expanding its data center networking solutions, helping to tie GPUs together to handle complex workloads.
| Company |
P/E |
P/B |
P/S |
ROE |
EBITDA (in billions) |
Gross Profit (in billions) |
Revenue Growth |
| NVIDIA Corp |
52.18 |
44.54 |
27.33 |
28.72% |
$31.94 |
$33.85 |
55.6% |
| Broadcom Inc |
83.24 |
20.92 |
26.20 |
5.8% |
$8.29 |
$10.7 |
22.03% |
| Taiwan Semiconductor Manufacturing Co Ltd |
30.78 |
9.71 |
13.08 |
8.71% |
$684.78 |
$547.37 |
38.65% |
| Advanced Micro Devices Inc |
128.68 |
5.85 |
11.85 |
1.48% |
$0.72 |
$3.06 |
31.71% |
| Micron Technology Inc |
23.93 |
3.76 |
5.47 |
6.1% |
$5.9 |
$5.05 |
46.0% |
| Qualcomm Inc |
14.83 |
6.09 |
3.96 |
9.71% |
$3.52 |
$5.76 |
10.35% |
| ARM Holdings PLC |
234.56 |
23.40 |
39.98 |
1.88% |
$0.17 |
$1.02 |
12.14% |
| Texas Instruments Inc |
31.39 |
9.52 |
9.44 |
7.85% |
$2.09 |
$2.58 |
16.38% |
| Analog Devices Inc |
57.33 |
3.25 |
10.80 |
1.5% |
$1.33 |
$1.79 |
24.57% |
| NXP Semiconductors NV |
24.48 |
5.41 |
4.33 |
4.71% |
$0.92 |
$1.56 |
-6.43% |
| Monolithic Power Systems Inc |
23.66 |
12.73 |
17.20 |
4.01% |
$0.18 |
$0.37 |
30.97% |
| First Solar Inc |
19.31 |
2.84 |
5.59 |
4.09% |
$0.49 |
$0.5 |
8.58% |
| STMicroelectronics NV |
57.68 |
1.29 |
2.14 |
-0.05% |
$0.62 |
$0.65 |
-14.42% |
| ASE Technology Holding Co Ltd |
22.51 |
2.51 |
1.20 |
2.49% |
$26.99 |
$25.69 |
7.5% |
| Credo Technology Group Holding Ltd |
192.82 |
30.74 |
43.03 |
8.67% |
$0.07 |
$0.15 |
273.57% |
| ON Semiconductor Corp |
43.56 |
2.36 |
3.03 |
2.13% |
$0.38 |
$0.55 |
-15.36% |
| United Microelectronics Corp |
13.14 |
1.64 |
2.28 |
2.45% |
$24.98 |
$16.88 |
3.45% |
| Skyworks Solutions Inc |
27.55 |
1.82 |
2.73 |
1.81% |
$0.23 |
$0.4 |
6.57% |
| Rambus Inc |
42.45 |
7.85 |
15.06 |
4.85% |
$0.08 |
$0.14 |
30.33% |
| Lattice Semiconductor Corp |
301.22 |
13.80 |
19.55 |
0.42% |
$0.02 |
$0.08 |
-0.08% |
| Average |
72.27 |
8.71 |
12.47 |
4.14% |
$40.09 |
$32.86 |
27.71% |
By closely examining NVIDIA, we can identify the following trends:
-
A Price to Earnings ratio of 52.18 significantly below the industry average by 0.72x suggests undervaluation. This can make the stock appealing for those seeking growth.
-
It could be trading at a premium in relation to its book value, as indicated by its Price to Book ratio of 44.54 which exceeds the industry average by 5.11x.
-
The stock's relatively high Price to Sales ratio of 27.33, surpassing the industry average by 2.19x, may indicate an aspect of overvaluation in terms of sales performance.
-
With a Return on Equity (ROE) of 28.72% that is 24.58% above the industry average, it appears that the company exhibits efficient use of equity to generate profits.
-
The Earnings Before Interest, Taxes, Depreciation, and Amortization (EBITDA) of $31.94 Billion is 0.8x below the industry average, suggesting potential lower profitability or financial challenges.
-
The company has higher gross profit of $33.85 Billion, which indicates 1.03x above the industry average, indicating stronger profitability and higher earnings from its core operations.
-
The company's revenue growth of 55.6% exceeds the industry average of 27.71%, indicating strong sales performance and market outperformance.
Debt To Equity Ratio
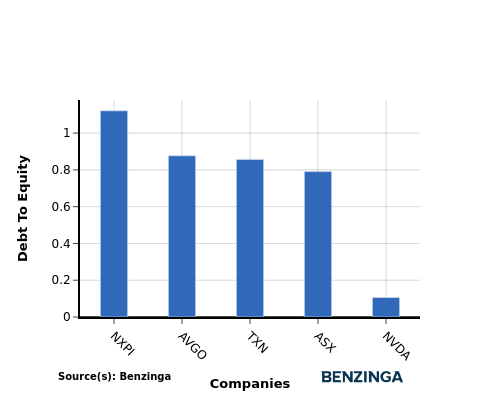
The debt-to-equity (D/E) ratio helps evaluate the capital structure and financial leverage of a company.
Considering the debt-to-equity ratio in industry comparisons allows for a concise evaluation of a company's financial health and risk profile, aiding in informed decision-making.
In terms of the Debt-to-Equity ratio, NVIDIA stands in comparison with its top 4 peers, leading to the following comparisons:
-
When considering the debt-to-equity ratio, NVIDIA exhibits a stronger financial position compared to its top 4 peers.
-
This indicates that the company has a favorable balance between debt and equity, with a lower debt-to-equity ratio of 0.11, which can be perceived as a positive aspect by investors.
Key Takeaways
For NVIDIA, the PE ratio is low compared to peers, indicating potential undervaluation. The high PB and PS ratios suggest strong market sentiment and revenue multiples. A high ROE reflects efficient use of shareholder funds, while low EBITDA may indicate lower cash generation. The high gross profit margin signifies strong profitability, and high revenue growth indicates a promising future outlook within the Semiconductors & Semiconductor Equipment industry.
This article was generated by Benzinga's automated content engine and reviewed by an editor.
Posted In: NVDA


