AXT's Earnings: A Preview
Author: Benzinga Insights | July 30, 2025 04:02pm
AXT (NASDAQ:AXTI) will release its quarterly earnings report on Thursday, 2025-07-31. Here's a brief overview for investors ahead of the announcement.
Analysts anticipate AXT to report an earnings per share (EPS) of $-0.14.
Investors in AXT are eagerly awaiting the company's announcement, hoping for news of surpassing estimates and positive guidance for the next quarter.
It's worth noting for new investors that stock prices can be heavily influenced by future projections rather than just past performance.
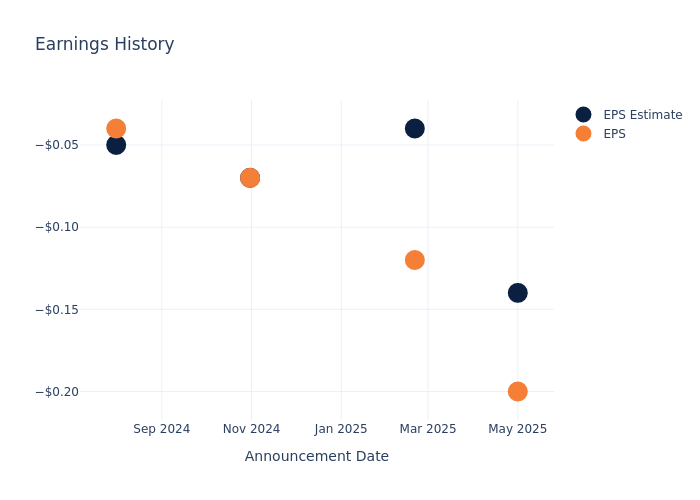
Earnings History Snapshot
During the last quarter, the company reported an EPS missed by $0.06, leading to a 2.96% increase in the share price on the subsequent day.
Here's a look at AXT's past performance and the resulting price change:
| Quarter |
Q1 2025 |
Q4 2024 |
Q3 2024 |
Q2 2024 |
| EPS Estimate |
-0.14 |
-0.04 |
-0.07 |
-0.05 |
| EPS Actual |
-0.20 |
-0.12 |
-0.07 |
-0.04 |
| Price Change % |
3.0% |
-31.0% |
-18.0% |
-19.0% |
Stock Performance
Shares of AXT were trading at $2.29 as of July 29. Over the last 52-week period, shares are down 35.56%. Given that these returns are generally negative, long-term shareholders are likely bearish going into this earnings release.
Analyst Opinions on AXT
For investors, grasping market sentiments and expectations in the industry is vital. This analysis explores the latest insights regarding AXT.
With 3 analyst ratings, AXT has a consensus rating of Buy. The average one-year price target is $4.35, indicating a potential 89.96% upside.
Comparing Ratings with Competitors
In this comparison, we explore the analyst ratings and average 1-year price targets of inTest, Aeluma and Ichor Holdings, three prominent industry players, offering insights into their relative performance expectations and market positioning.
- Analysts currently favor an Buy trajectory for inTest, with an average 1-year price target of $8.0, suggesting a potential 249.34% upside.
- Analysts currently favor an Buy trajectory for Aeluma, with an average 1-year price target of $25.5, suggesting a potential 1013.54% upside.
- Analysts currently favor an Buy trajectory for Ichor Holdings, with an average 1-year price target of $34.33, suggesting a potential 1399.13% upside.
Summary of Peers Analysis
The peer analysis summary presents essential metrics for inTest, Aeluma and Ichor Holdings, unveiling their respective standings within the industry and providing valuable insights into their market positions and comparative performance.
| Company |
Consensus |
Revenue Growth |
Gross Profit |
Return on Equity |
| AXT |
Buy |
-14.69% |
$-1.24M |
-4.77% |
| inTest |
Buy |
-10.69% |
$11.06M |
-2.34% |
| Aeluma |
Buy |
264.93% |
$841.88K |
17.22% |
| Ichor Holdings |
Buy |
21.39% |
$28.52M |
-0.65% |
Key Takeaway:
AXT is at the bottom for Revenue Growth and Gross Profit, with negative values. It is in the middle for Return on Equity.
About AXT
AXT Inc is a developer and producer of compound and single element semiconductor substrates, also known as wafers. The dominant substrates used in producing semiconductor chips and other electronic circuits are made from silicon. It is engaged in the design, development, manufacture, and distribution of high-performance compound semiconductor substrates and the sale of materials. The company provides alternative or specialty materials in the form of substrates or wafers, including compound and single-element substrates. Its compound substrates combine indium with phosphorous or gallium with arsenic. Geographically firm has its business presence across the region of Europe, Japan, Taiwan, China, North America, and the Asia Pacific from which China derives its maximum revenue to the company.
AXT's Financial Performance
Market Capitalization: With restricted market capitalization, the company is positioned below industry averages. This reflects a smaller scale relative to peers.
Negative Revenue Trend: Examining AXT's financials over 3 months reveals challenges. As of 31 March, 2025, the company experienced a decline of approximately -14.69% in revenue growth, reflecting a decrease in top-line earnings. When compared to others in the Information Technology sector, the company faces challenges, achieving a growth rate lower than the average among peers.
Net Margin: AXT's net margin excels beyond industry benchmarks, reaching -45.68%. This signifies efficient cost management and strong financial health.
Return on Equity (ROE): AXT's ROE stands out, surpassing industry averages. With an impressive ROE of -4.77%, the company demonstrates effective use of equity capital and strong financial performance.
Return on Assets (ROA): AXT's ROA surpasses industry standards, highlighting the company's exceptional financial performance. With an impressive -2.63% ROA, the company effectively utilizes its assets for optimal returns.
Debt Management: AXT's debt-to-equity ratio surpasses industry norms, standing at 0.3. This suggests the company carries a substantial amount of debt, posing potential financial challenges.
To track all earnings releases for AXT visit their earnings calendar on our site.
This article was generated by Benzinga's automated content engine and reviewed by an editor.
Posted In: AXTI


