What to Expect from Sylvamo's Earnings
Author: Benzinga Insights | August 07, 2025 11:06am
Sylvamo (NYSE:SLVM) is preparing to release its quarterly earnings on Friday, 2025-08-08. Here's a brief overview of what investors should keep in mind before the announcement.
Analysts expect Sylvamo to report an earnings per share (EPS) of $0.43.
Sylvamo bulls will hope to hear the company announce they've not only beaten that estimate, but also to provide positive guidance, or forecasted growth, for the next quarter.
New investors should note that it is sometimes not an earnings beat or miss that most affects the price of a stock, but the guidance (or forecast).
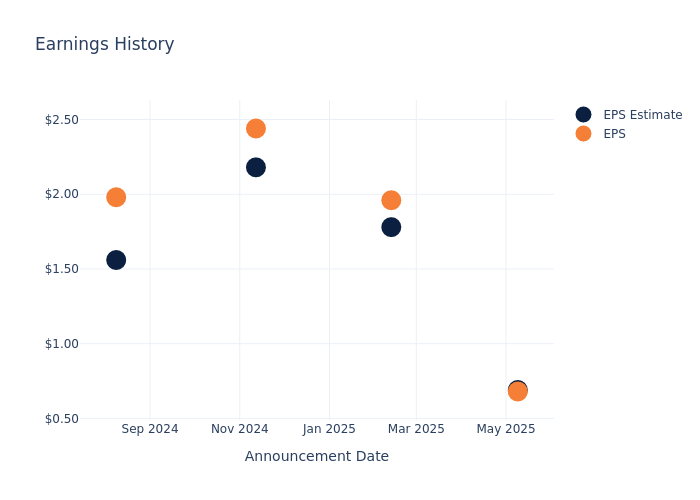
Historical Earnings Performance
During the last quarter, the company reported an EPS missed by $0.01, leading to a 0.0% drop in the share price on the subsequent day.
Here's a look at Sylvamo's past performance and the resulting price change:
| Quarter |
Q1 2025 |
Q4 2024 |
Q3 2024 |
Q2 2024 |
| EPS Estimate |
0.69 |
1.78 |
2.18 |
1.56 |
| EPS Actual |
0.68 |
1.96 |
2.44 |
1.98 |
| Price Change % |
-13.0% |
2.0% |
-8.0% |
12.0% |
Sylvamo Share Price Analysis
Shares of Sylvamo were trading at $47.4 as of August 06. Over the last 52-week period, shares are down 36.76%. Given that these returns are generally negative, long-term shareholders are likely unhappy going into this earnings release.
Analyst Opinions on Sylvamo
Understanding market sentiments and expectations within the industry is crucial for investors. This analysis delves into the latest insights on Sylvamo.
The consensus rating for Sylvamo is Neutral, based on 2 analyst ratings. With an average one-year price target of $62.5, there's a potential 31.86% upside.
Comparing Ratings with Peers
The analysis below examines the analyst ratings and average 1-year price targets of Magnera, Clearwater Paper and Mercer Intl, three significant industry players, providing valuable insights into their relative performance expectations and market positioning.
- Analysts currently favor an Neutral trajectory for Magnera, with an average 1-year price target of $15.0, suggesting a potential 68.35% downside.
- Analysts currently favor an Outperform trajectory for Clearwater Paper, with an average 1-year price target of $36.0, suggesting a potential 24.05% downside.
- Analysts currently favor an Neutral trajectory for Mercer Intl, with an average 1-year price target of $3.5, suggesting a potential 92.62% downside.
Peers Comparative Analysis Summary
The peer analysis summary provides a snapshot of key metrics for Magnera, Clearwater Paper and Mercer Intl, illuminating their respective standings within the industry. These metrics offer valuable insights into their market positions and comparative performance.
| Company |
Consensus |
Revenue Growth |
Gross Profit |
Return on Equity |
| Sylvamo |
Neutral |
-9.28% |
$159M |
3.08% |
| Magnera |
Neutral |
151.79% |
$88M |
-3.73% |
| Clearwater Paper |
Outperform |
13.76% |
$43M |
0.32% |
| Mercer Intl |
Neutral |
-9.18% |
$-27.97M |
-19.48% |
Key Takeaway:
Sylvamo ranks at the bottom for Revenue Growth and Gross Profit, with negative growth and lower profit compared to peers. It also has the lowest Return on Equity. Overall, Sylvamo's performance is weaker compared to its peers in terms of financial metrics.
About Sylvamo
Sylvamo Corp is an uncoated papers company with a broad portfolio of top-tier brands and low-cost, large-scale paper mills, it produces uncoated freesheet (UFS) for paper products such as cut size and offset paper, as well as market pulp. The company offers Copy and Printer papers, Commercial Printing papers, Converting papers and Specialty papers. It operates in three geographical segments: Europe, Latin America, and North America. Key revenue is generated from North America.
Sylvamo: Delving into Financials
Market Capitalization Perspectives: The company's market capitalization falls below industry averages, signaling a relatively smaller size compared to peers. This positioning may be influenced by factors such as perceived growth potential or operational scale.
Revenue Challenges: Sylvamo's revenue growth over 3 months faced difficulties. As of 31 March, 2025, the company experienced a decline of approximately -9.28%. This indicates a decrease in top-line earnings. In comparison to its industry peers, the company trails behind with a growth rate lower than the average among peers in the Materials sector.
Net Margin: Sylvamo's net margin excels beyond industry benchmarks, reaching 3.29%. This signifies efficient cost management and strong financial health.
Return on Equity (ROE): The company's ROE is a standout performer, exceeding industry averages. With an impressive ROE of 3.08%, the company showcases effective utilization of equity capital.
Return on Assets (ROA): Sylvamo's ROA stands out, surpassing industry averages. With an impressive ROA of 1.03%, the company demonstrates effective utilization of assets and strong financial performance.
Debt Management: The company maintains a balanced debt approach with a debt-to-equity ratio below industry norms, standing at 0.9.
To track all earnings releases for Sylvamo visit their earnings calendar on our site.
This article was generated by Benzinga's automated content engine and reviewed by an editor.
Posted In: SLVM


