PBF Energy's Earnings: A Preview
Author: Benzinga Insights | October 29, 2025 02:01pm
PBF Energy (NYSE:PBF) is set to give its latest quarterly earnings report on Thursday, 2025-10-30. Here's what investors need to know before the announcement.
Analysts estimate that PBF Energy will report an earnings per share (EPS) of $-0.73.
The announcement from PBF Energy is eagerly anticipated, with investors seeking news of surpassing estimates and favorable guidance for the next quarter.
It's worth noting for new investors that guidance can be a key determinant of stock price movements.
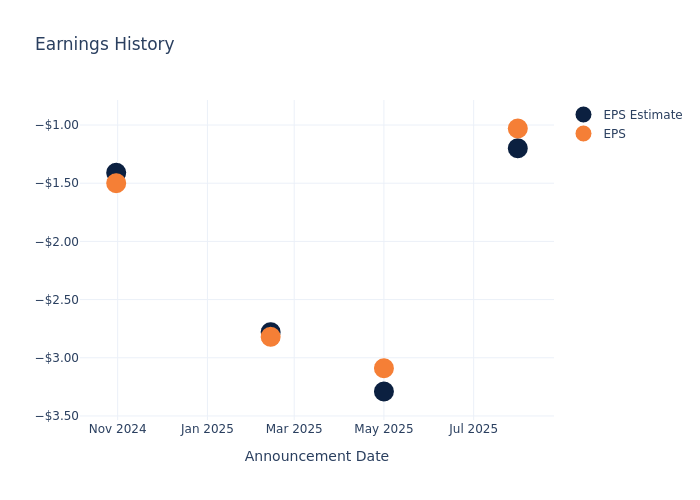
Earnings Track Record
Last quarter the company beat EPS by $0.17, which was followed by a 4.07% drop in the share price the next day.
Here's a look at PBF Energy's past performance and the resulting price change:
| Quarter |
Q2 2025 |
Q1 2025 |
Q4 2024 |
Q3 2024 |
| EPS Estimate |
-1.20 |
-3.29 |
-2.78 |
-1.41 |
| EPS Actual |
-1.03 |
-3.09 |
-2.82 |
-1.50 |
| Price Change % |
-4.00 |
5.00 |
0.00 |
-2.00 |
Market Performance of PBF Energy's Stock
Shares of PBF Energy were trading at $32.78 as of October 28. Over the last 52-week period, shares are up 19.71%. Given that these returns are generally positive, long-term shareholders should be satisfied going into this earnings release.
Analyst Observations about PBF Energy
Understanding market sentiments and expectations within the industry is crucial for investors. This analysis delves into the latest insights on PBF Energy.
Analysts have given PBF Energy a total of 8 ratings, with the consensus rating being Underperform. The average one-year price target is $27.5, indicating a potential 16.11% downside.
Analyzing Ratings Among Peers
This comparison focuses on the analyst ratings and average 1-year price targets of CVR Energy, Delek US Hldgs and Par Pacific Hldgs, three major players in the industry, shedding light on their relative performance expectations and market positioning.
- Analysts currently favor an Sell trajectory for CVR Energy, with an average 1-year price target of $26.67, suggesting a potential 18.64% downside.
- Analysts currently favor an Neutral trajectory for Delek US Hldgs, with an average 1-year price target of $33.62, suggesting a potential 2.56% upside.
- Analysts currently favor an Neutral trajectory for Par Pacific Hldgs, with an average 1-year price target of $40.67, suggesting a potential 24.07% upside.
Peers Comparative Analysis Summary
In the peer analysis summary, key metrics for CVR Energy, Delek US Hldgs and Par Pacific Hldgs are highlighted, providing an understanding of their respective standings within the industry and offering insights into their market positions and comparative performance.
| Company |
Consensus |
Revenue Growth |
Gross Profit |
Return on Equity |
| PBF Energy |
Underperform |
-14.43% |
$-58M |
-0.10% |
| CVR Energy |
Sell |
-10.47% |
$-68M |
-21.80% |
| Delek US Hldgs |
Neutral |
-16.43% |
$45.70M |
-117.31% |
| Par Pacific Hldgs |
Neutral |
-6.15% |
$265.25M |
5.26% |
Key Takeaway:
PBF Energy ranks at the bottom for Revenue Growth and Gross Profit among its peers. It is also at the bottom for Return on Equity. Overall, PBF Energy is underperforming compared to its peers in terms of financial performance.
Delving into PBF Energy's Background
PBF Energy Inc is an independent petroleum refiner and supplier of unbranded transportation fuels, heating oil, petrochemical feedstocks, lubricants, and other petroleum products in the United States. The company owns refineries in Delaware, Ohio, New Jersey, California, and Louisiana. The Company operates in two reportable business segments: Refining and Logistics. The Company's oil refineries are all engaged in the refining of crude oil and other feedstocks into petroleum products and are aggregated into the Refining segment. PBFX operates logistics assets such as crude oil and refined products terminals, pipelines and storage facilities. The Logistics segment consists solely of PBFX's operations.
PBF Energy's Financial Performance
Market Capitalization Analysis: The company's market capitalization is below the industry average, suggesting that it is relatively smaller compared to peers. This could be due to various factors, including perceived growth potential or operational scale.
Decline in Revenue: Over the 3 months period, PBF Energy faced challenges, resulting in a decline of approximately -14.43% in revenue growth as of 30 June, 2025. This signifies a reduction in the company's top-line earnings. When compared to others in the Energy sector, the company faces challenges, achieving a growth rate lower than the average among peers.
Net Margin: The company's net margin is a standout performer, exceeding industry averages. With an impressive net margin of -0.07%, the company showcases strong profitability and effective cost control.
Return on Equity (ROE): PBF Energy's ROE surpasses industry standards, highlighting the company's exceptional financial performance. With an impressive -0.1% ROE, the company effectively utilizes shareholder equity capital.
Return on Assets (ROA): PBF Energy's ROA stands out, surpassing industry averages. With an impressive ROA of -0.04%, the company demonstrates effective utilization of assets and strong financial performance.
Debt Management: The company maintains a balanced debt approach with a debt-to-equity ratio below industry norms, standing at 0.63.
To track all earnings releases for PBF Energy visit their earnings calendar on our site.
This article was generated by Benzinga's automated content engine and reviewed by an editor.
Posted In: PBF


