Stock Of The Day: Where Will The Lam Research Selloff End?
Author: Mark Putrino | October 08, 2025 03:17pm
Shares of Lam Research Corporation (NASDAQ:LRCX) are higher Wednesday. This follows Tuesday’s selloff of almost 6%.
There was a sign on Monday that the stock would trade lower Tuesday. This is why Lam Research is our Stock of the Day.
If understood and applied correctly, technical analysis is the study of supply and demand in a market.
If a stock is going down, the bears are in charge. There isn't enough demand or buy orders to absorb all of the supply or sell orders. Sellers must undercut each other's prices to attract the interest of buyers.
This forces the stock into a downtrend.
The opposite is true if a market is moving higher. There isn't enough supply to fill all of the demand. Buyers are forced to outbid each other to get sellers interested. This can put the stock into an uptrend.
The only guarantee in the stock market is that the trend will eventually end. Stocks are always going up, down, or sideways.
When the leadership is changing from bulls to bears or bears to bulls, the price action can manifest itself on a chart as a reversal pattern. This is one of the things that technical analysts look for.
If the leadership change is slow and takes place over an extended period of time, it could appear as a ‘rounded' top or bottom. If the change occurs quickly over the course of a few days, it can appear as a ‘V' top or bottom.
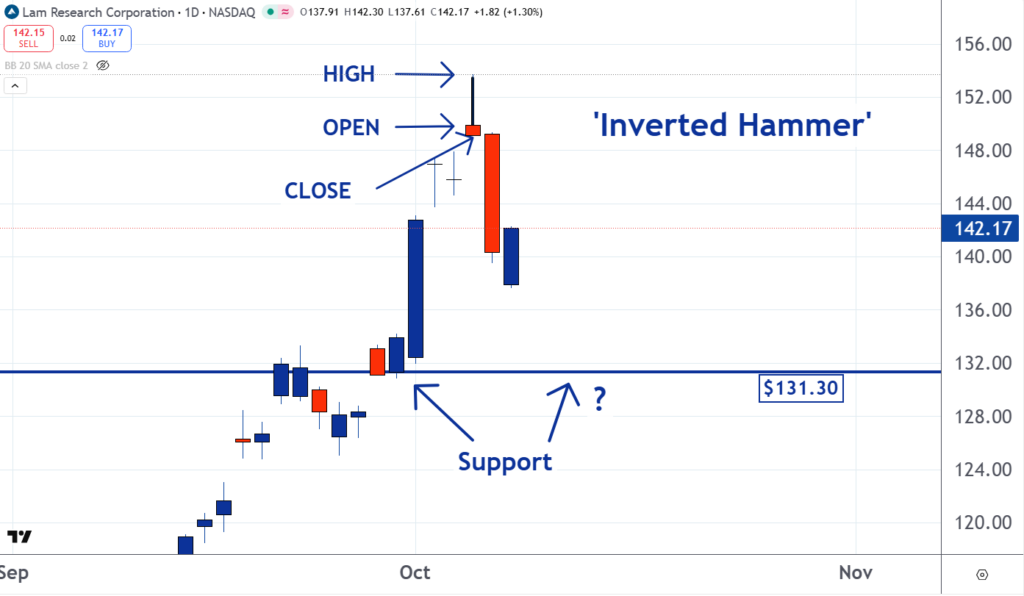
Sometimes the leadership change can take place in just one day. Analysts call these reversal days. The ‘inverted hammer' pattern that formed on the Lam Research chart shows that the sellers took over on Monday.
The stock opened at $149.90. It got as high as $153.70, but by the close the sellers overpowered the buyers. It closed at $149.15. This action appears as an inverted hammer pattern on the chart.
Many technical analysts try to identify patterns on charts without understanding why they form. But understanding price action and how it relates to supply and demand is the real key to success.