What Analysts Are Saying About Johnson & Johnson Stock
Author: Benzinga Insights | October 09, 2025 04:01pm
Providing a diverse range of perspectives from bullish to bearish, 14 analysts have published ratings on Johnson & Johnson (NYSE:JNJ) in the last three months.
The table below provides a concise overview of recent ratings by analysts, offering insights into the changing sentiments over the past 30 days and drawing comparisons with the preceding months for a holistic perspective.
|
Bullish |
Somewhat Bullish |
Indifferent |
Somewhat Bearish |
Bearish |
| Total Ratings |
5 |
2 |
7 |
0 |
0 |
| Last 30D |
1 |
0 |
0 |
0 |
0 |
| 1M Ago |
2 |
1 |
3 |
0 |
0 |
| 2M Ago |
1 |
0 |
0 |
0 |
0 |
| 3M Ago |
1 |
1 |
4 |
0 |
0 |
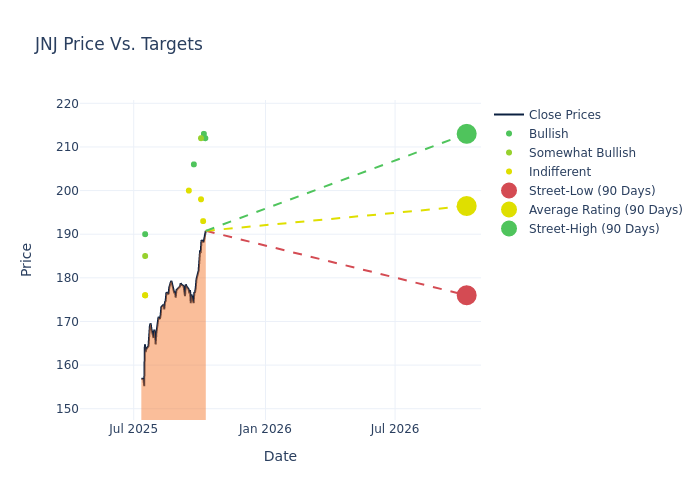
Providing deeper insights, analysts have established 12-month price targets, indicating an average target of $193.07, along with a high estimate of $213.00 and a low estimate of $167.00. Marking an increase of 9.79%, the current average surpasses the previous average price target of $175.86.
Analyzing Analyst Ratings: A Detailed Breakdown
The standing of Johnson & Johnson among financial experts is revealed through an in-depth exploration of recent analyst actions. The summary below outlines key analysts, their recent evaluations, and adjustments to ratings and price targets.
| Analyst |
Analyst Firm |
Action Taken |
Rating |
Current Price Target |
Prior Price Target |
| Asad Haider |
Goldman Sachs |
Raises |
Buy |
$212.00 |
$186.00 |
| Joanne Wuensch |
Citigroup |
Raises |
Buy |
$213.00 |
$200.00 |
| Lee Hambright |
Bernstein |
Raises |
Market Perform |
$193.00 |
$172.00 |
| Tim Anderson |
B of A Securities |
Raises |
Neutral |
$198.00 |
$175.00 |
| Larry Biegelsen |
Wells Fargo |
Raises |
Overweight |
$212.00 |
$170.00 |
| Vamil Divan |
Guggenheim |
Raises |
Buy |
$206.00 |
$167.00 |
| Michael Weinstein |
JP Morgan |
Raises |
Neutral |
$200.00 |
$185.00 |
| Joanne Wuensch |
Citigroup |
Raises |
Buy |
$200.00 |
$185.00 |
| Matt Miksic |
Barclays |
Raises |
Equal-Weight |
$176.00 |
$165.00 |
| Shagun Singh |
RBC Capital |
Raises |
Outperform |
$185.00 |
$181.00 |
| Vamil Divan |
Guggenheim |
Raises |
Neutral |
$167.00 |
$164.00 |
| Danielle Antalffy |
UBS |
Raises |
Buy |
$190.00 |
$180.00 |
| Terence Flynn |
Morgan Stanley |
Raises |
Equal-Weight |
$176.00 |
$171.00 |
| Tim Anderson |
B of A Securities |
Raises |
Neutral |
$175.00 |
$161.00 |
Key Insights:
- Action Taken: In response to dynamic market conditions and company performance, analysts update their recommendations. Whether they 'Maintain', 'Raise', or 'Lower' their stance, it signifies their reaction to recent developments related to Johnson & Johnson. This insight gives a snapshot of analysts' perspectives on the current state of the company.
- Rating: Gaining insights, analysts provide qualitative assessments, ranging from 'Outperform' to 'Underperform'. These ratings reflect expectations for the relative performance of Johnson & Johnson compared to the broader market.
- Price Targets: Analysts predict movements in price targets, offering estimates for Johnson & Johnson's future value. Examining the current and prior targets offers insights into analysts' evolving expectations.
Understanding these analyst evaluations alongside key financial indicators can offer valuable insights into Johnson & Johnson's market standing. Stay informed and make well-considered decisions with our Ratings Table.
Stay up to date on Johnson & Johnson analyst ratings.
Unveiling the Story Behind Johnson & Johnson
Johnson & Johnson is the world's largest and most diverse healthcare firm. It has two divisions: innovative medicine and medtech. These now represent all of the company's sales following the divestment of the consumer business, Kenvue, in 2023. After restructurings in 2023-24, the drug division focuses on three main therapeutic areas: immunology, oncology, and neurology. Geographically, just over half of total revenue is generated in the United States.
Johnson & Johnson's Financial Performance
Market Capitalization Highlights: Above the industry average, the company's market capitalization signifies a significant scale, indicating strong confidence and market prominence.
Positive Revenue Trend: Examining Johnson & Johnson's financials over 3M reveals a positive narrative. The company achieved a noteworthy revenue growth rate of 5.77% as of 30 June, 2025, showcasing a substantial increase in top-line earnings. As compared to competitors, the company encountered difficulties, with a growth rate lower than the average among peers in the Health Care sector.
Net Margin: Johnson & Johnson's net margin excels beyond industry benchmarks, reaching 23.32%. This signifies efficient cost management and strong financial health.
Return on Equity (ROE): Johnson & Johnson's ROE excels beyond industry benchmarks, reaching 7.07%. This signifies robust financial management and efficient use of shareholder equity capital.
Return on Assets (ROA): Johnson & Johnson's ROA excels beyond industry benchmarks, reaching 2.86%. This signifies efficient management of assets and strong financial health.
Debt Management: Johnson & Johnson's debt-to-equity ratio is below the industry average at 0.65, reflecting a lower dependency on debt financing and a more conservative financial approach.
Understanding the Relevance of Analyst Ratings
Benzinga tracks 150 analyst firms and reports on their stock expectations. Analysts typically arrive at their conclusions by predicting how much money a company will make in the future, usually the upcoming five years, and how risky or predictable that company's revenue streams are.
Analysts attend company conference calls and meetings, research company financial statements, and communicate with insiders to publish their ratings on stocks. Analysts typically rate each stock once per quarter or whenever the company has a major update.
Some analysts publish their predictions for metrics such as growth estimates, earnings, and revenue to provide additional guidance with their ratings. When using analyst ratings, it is important to keep in mind that stock and sector analysts are also human and are only offering their opinions to investors.
If you want to keep track of which analysts are outperforming others, you can view updated analyst ratings along withanalyst success scores in Benzinga Pro.
Which Stocks Are Analysts Recommending Now?
Benzinga Edge gives you instant access to all major analyst upgrades, downgrades, and price targets. Sort by accuracy, upside potential, and more. Click here to stay ahead of the market.
This article was generated by Benzinga's automated content engine and reviewed by an editor.
Posted In: JNJ


