A Peek at Johnson & Johnson's Future Earnings
Author: Benzinga Insights | October 13, 2025 10:00am
Johnson & Johnson (NYSE:JNJ) is set to give its latest quarterly earnings report on Tuesday, 2025-10-14. Here's what investors need to know before the announcement.
Analysts estimate that Johnson & Johnson will report an earnings per share (EPS) of $2.76.
The announcement from Johnson & Johnson is eagerly anticipated, with investors seeking news of surpassing estimates and favorable guidance for the next quarter.
It's worth noting for new investors that guidance can be a key determinant of stock price movements.
Historical Earnings Performance
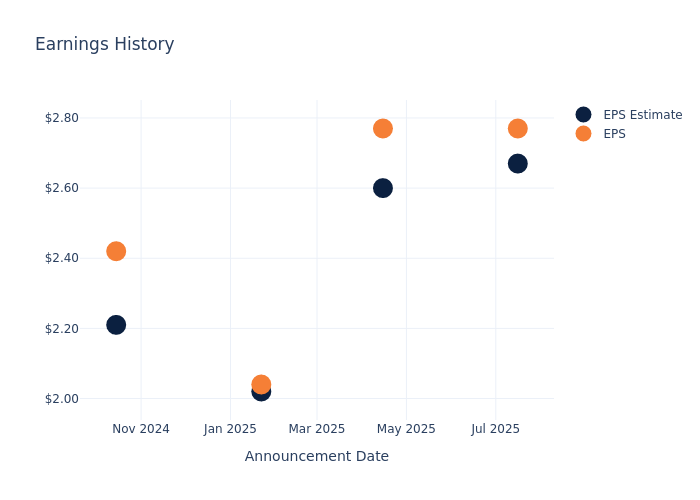
In the previous earnings release, the company beat EPS by $0.10, leading to a 1.09% drop in the share price the following trading session.
Here's a look at Johnson & Johnson's past performance and the resulting price change:
| Quarter |
Q2 2025 |
Q1 2025 |
Q4 2024 |
Q3 2024 |
| EPS Estimate |
2.67 |
2.60 |
2.02 |
2.21 |
| EPS Actual |
2.77 |
2.77 |
2.04 |
2.42 |
| Price Change % |
-1.00% |
0.00% |
1.00% |
0.00% |
Performance of Johnson & Johnson Shares
Shares of Johnson & Johnson were trading at $190.72 as of October 10. Over the last 52-week period, shares are up 16.12%. Given that these returns are generally positive, long-term shareholders are likely bullish going into this earnings release.
Analyst Opinions on Johnson & Johnson
Understanding market sentiments and expectations within the industry is crucial for investors. This analysis delves into the latest insights on Johnson & Johnson.
Analysts have given Johnson & Johnson a total of 15 ratings, with the consensus rating being Neutral. The average one-year price target is $192.07, indicating a potential 0.71% upside.
Comparing Ratings with Peers
The analysis below examines the analyst ratings and average 1-year price targets of Merck & Co, Eli Lilly and Pfizer, three significant industry players, providing valuable insights into their relative performance expectations and market positioning.
- Analysts currently favor an Neutral trajectory for Merck & Co, with an average 1-year price target of $91.67, suggesting a potential 51.93% downside.
- Analysts currently favor an Buy trajectory for Eli Lilly, with an average 1-year price target of $914.6, suggesting a potential 379.55% upside.
- Analysts currently favor an Neutral trajectory for Pfizer, with an average 1-year price target of $29.8, suggesting a potential 84.37% downside.
Insights: Peer Analysis
The peer analysis summary offers a detailed examination of key metrics for Merck & Co, Eli Lilly and Pfizer, providing valuable insights into their respective standings within the industry and their market positions and comparative performance.
| Company |
Consensus |
Revenue Growth |
Gross Profit |
Return on Equity |
| Johnson & Johnson |
Neutral |
5.77% |
$16.11B |
7.07% |
| Merck & Co |
Neutral |
-1.90% |
$12.25B |
9.10% |
| Eli Lilly |
Buy |
37.64% |
$13.11B |
33.26% |
| Pfizer |
Neutral |
10.31% |
$10.88B |
3.25% |
Key Takeaway:
Johnson & Johnson ranks highest in Gross Profit and Return on Equity among its peers. It is in the middle for Revenue Growth.
Discovering Johnson & Johnson: A Closer Look
Johnson & Johnson is the world's largest and most diverse healthcare firm. It has two divisions: innovative medicine and medtech. These now represent all of the company's sales following the divestment of the consumer business, Kenvue, in 2023. After restructurings in 2023-24, the drug division focuses on three main therapeutic areas: immunology, oncology, and neurology. Geographically, just over half of total revenue is generated in the United States.
Key Indicators: Johnson & Johnson's Financial Health
Market Capitalization Analysis: With an elevated market capitalization, the company stands out above industry averages, showcasing substantial size and market acknowledgment.
Positive Revenue Trend: Examining Johnson & Johnson's financials over 3 months reveals a positive narrative. The company achieved a noteworthy revenue growth rate of 5.77% as of 30 June, 2025, showcasing a substantial increase in top-line earnings. When compared to others in the Health Care sector, the company faces challenges, achieving a growth rate lower than the average among peers.
Net Margin: Johnson & Johnson's net margin is impressive, surpassing industry averages. With a net margin of 23.32%, the company demonstrates strong profitability and effective cost management.
Return on Equity (ROE): The company's ROE is a standout performer, exceeding industry averages. With an impressive ROE of 7.07%, the company showcases effective utilization of equity capital.
Return on Assets (ROA): Johnson & Johnson's ROA surpasses industry standards, highlighting the company's exceptional financial performance. With an impressive 2.86% ROA, the company effectively utilizes its assets for optimal returns.
Debt Management: Johnson & Johnson's debt-to-equity ratio is below the industry average. With a ratio of 0.65, the company relies less on debt financing, maintaining a healthier balance between debt and equity, which can be viewed positively by investors.
To track all earnings releases for Johnson & Johnson visit their earnings calendar on our site.
This article was generated by Benzinga's automated content engine and reviewed by an editor.
Posted In: JNJ


