Demystifying MGM Resorts International: Insights From 11 Analyst Reviews
Author: Benzinga Insights | October 13, 2025 06:00pm
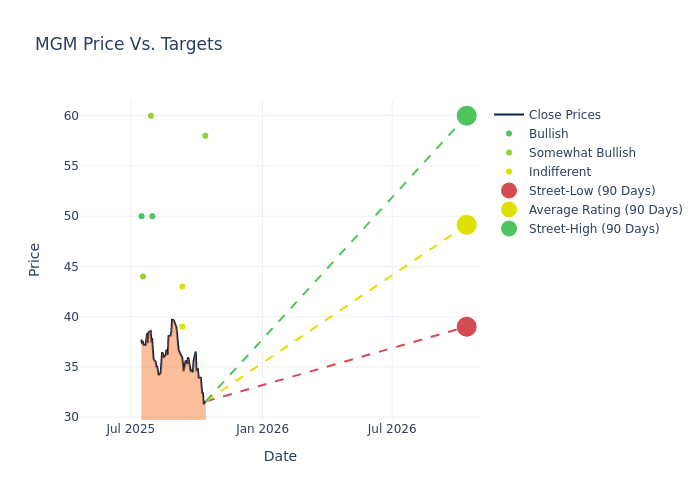
Ratings for MGM Resorts International (NYSE:MGM) were provided by 11 analysts in the past three months, showcasing a mix of bullish and bearish perspectives.
The table below summarizes their recent ratings, showcasing the evolving sentiments within the past 30 days and comparing them to the preceding months.
|
Bullish |
Somewhat Bullish |
Indifferent |
Somewhat Bearish |
Bearish |
| Total Ratings |
2 |
5 |
4 |
0 |
0 |
| Last 30D |
0 |
1 |
0 |
0 |
0 |
| 1M Ago |
0 |
1 |
0 |
0 |
0 |
| 2M Ago |
0 |
0 |
3 |
0 |
0 |
| 3M Ago |
2 |
3 |
1 |
0 |
0 |
Analysts' evaluations of 12-month price targets offer additional insights, showcasing an average target of $49.36, with a high estimate of $60.00 and a low estimate of $39.00. This upward trend is apparent, with the current average reflecting a 3.61% increase from the previous average price target of $47.64.
Analyzing Analyst Ratings: A Detailed Breakdown
A clear picture of MGM Resorts International's perception among financial experts is painted with a thorough analysis of recent analyst actions. The summary below outlines key analysts, their recent evaluations, and adjustments to ratings and price targets.
| Analyst |
Analyst Firm |
Action Taken |
Rating |
Current Price Target |
Prior Price Target |
| Ben Chaiken |
Mizuho |
Raises |
Outperform |
$58.00 |
$56.00 |
| Ben Chaiken |
Mizuho |
Lowers |
Outperform |
$56.00 |
$58.00 |
| Robin Farley |
UBS |
Lowers |
Neutral |
$39.00 |
$44.00 |
| Stephen Grambling |
Morgan Stanley |
Raises |
Equal-Weight |
$43.00 |
$41.00 |
| Robin Farley |
UBS |
Raises |
Neutral |
$44.00 |
$42.00 |
| Stephen Grambling |
Morgan Stanley |
Raises |
Equal-Weight |
$41.00 |
$38.00 |
| Ben Chaiken |
Mizuho |
Lowers |
Outperform |
$58.00 |
$59.00 |
| Steven Wieczynski |
Stifel |
Raises |
Buy |
$50.00 |
$48.00 |
| Joseph Stauff |
Susquehanna |
Raises |
Positive |
$60.00 |
$50.00 |
| Brandt Montour |
Barclays |
Raises |
Overweight |
$44.00 |
$43.00 |
| Barry Jonas |
Truist Securities |
Raises |
Buy |
$50.00 |
$45.00 |
Key Insights:
- Action Taken: In response to dynamic market conditions and company performance, analysts update their recommendations. Whether they 'Maintain', 'Raise', or 'Lower' their stance, it signifies their reaction to recent developments related to MGM Resorts International. This insight gives a snapshot of analysts' perspectives on the current state of the company.
- Rating: Analysts assign qualitative assessments to stocks, ranging from 'Outperform' to 'Underperform'. These ratings convey the analysts' expectations for the relative performance of MGM Resorts International compared to the broader market.
- Price Targets: Delving into movements, analysts provide estimates for the future value of MGM Resorts International's stock. This analysis reveals shifts in analysts' expectations over time.
Navigating through these analyst evaluations alongside other financial indicators can contribute to a holistic understanding of MGM Resorts International's market standing. Stay informed and make data-driven decisions with our Ratings Table.
Stay up to date on MGM Resorts International analyst ratings.
Unveiling the Story Behind MGM Resorts International
MGM Resorts is the largest resort operator on the Las Vegas Strip with 37,000 guest rooms and suites, representing about one fourth of all units in the market. The company's Vegas properties include MGM Grand, Mandalay Bay, Park MGM, Luxor, New York-New York, and Bellagio. The Strip contributed approximately 59% of total EBITDAR in 2024. MGM also owns US regional assets, which represented a low 20s share of 2024 EBITDAR (MGM's Macao EBITDAR was 21% of the total in 2024). MGM's US sports and i-gaming operations are currently a high-single-digit percentage of its total revenue. The company also operates the 56%-owned MGM China casinos with a new property that opened on the Cotai Strip in early 2018. We estimate MGM will open a resort in Japan in 2030.
Breaking Down MGM Resorts International's Financial Performance
Market Capitalization: Boasting an elevated market capitalization, the company surpasses industry averages. This signals substantial size and strong market recognition.
Positive Revenue Trend: Examining MGM Resorts International's financials over 3M reveals a positive narrative. The company achieved a noteworthy revenue growth rate of 1.79% as of 30 June, 2025, showcasing a substantial increase in top-line earnings. As compared to its peers, the revenue growth lags behind its industry peers. The company achieved a growth rate lower than the average among peers in Consumer Discretionary sector.
Net Margin: MGM Resorts International's net margin is below industry standards, pointing towards difficulties in achieving strong profitability. With a net margin of 1.11%, the company may encounter challenges in effective cost control.
Return on Equity (ROE): MGM Resorts International's ROE falls below industry averages, indicating challenges in efficiently using equity capital. With an ROE of 1.68%, the company may face hurdles in generating optimal returns for shareholders.
Return on Assets (ROA): The company's ROA is below industry benchmarks, signaling potential difficulties in efficiently utilizing assets. With an ROA of 0.12%, the company may need to address challenges in generating satisfactory returns from its assets.
Debt Management: MGM Resorts International's debt-to-equity ratio surpasses industry norms, standing at 10.5. This suggests the company carries a substantial amount of debt, posing potential financial challenges.
How Are Analyst Ratings Determined?
Benzinga tracks 150 analyst firms and reports on their stock expectations. Analysts typically arrive at their conclusions by predicting how much money a company will make in the future, usually the upcoming five years, and how risky or predictable that company's revenue streams are.
Analysts attend company conference calls and meetings, research company financial statements, and communicate with insiders to publish their ratings on stocks. Analysts typically rate each stock once per quarter or whenever the company has a major update.
Some analysts will also offer forecasts for metrics like growth estimates, earnings, and revenue to provide further guidance on stocks. Investors who use analyst ratings should note that this specialized advice comes from humans and may be subject to error.
Which Stocks Are Analysts Recommending Now?
Benzinga Edge gives you instant access to all major analyst upgrades, downgrades, and price targets. Sort by accuracy, upside potential, and more. Click here to stay ahead of the market.
This article was generated by Benzinga's automated content engine and reviewed by an editor.
Posted In: MGM


