Expert Outlook: FormFactor Through The Eyes Of 4 Analysts
Author: Benzinga Insights | October 13, 2025 06:01pm
FormFactor (NASDAQ:FORM) has been analyzed by 4 analysts in the last three months, revealing a diverse range of perspectives from bullish to bearish.
The following table encapsulates their recent ratings, offering a glimpse into the evolving sentiments over the past 30 days and comparing them to the preceding months.
|
Bullish |
Somewhat Bullish |
Indifferent |
Somewhat Bearish |
Bearish |
| Total Ratings |
1 |
0 |
3 |
0 |
0 |
| Last 30D |
0 |
0 |
1 |
0 |
0 |
| 1M Ago |
1 |
0 |
0 |
0 |
0 |
| 2M Ago |
0 |
0 |
1 |
0 |
0 |
| 3M Ago |
0 |
0 |
1 |
0 |
0 |
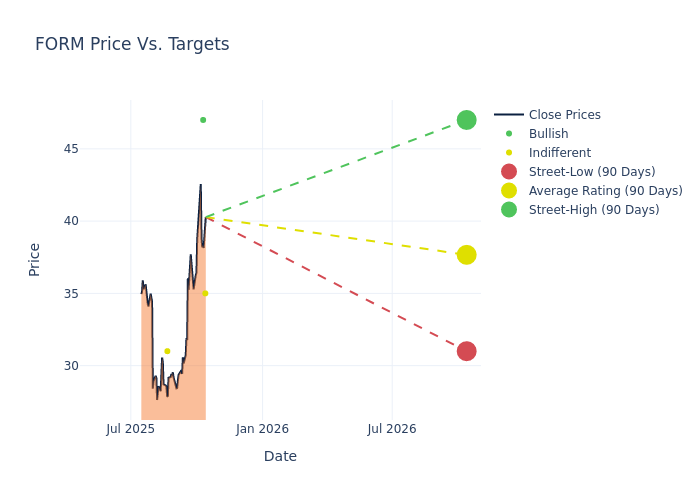
The 12-month price targets, analyzed by analysts, offer insights with an average target of $36.0, a high estimate of $47.00, and a low estimate of $31.00. Surpassing the previous average price target of $33.75, the current average has increased by 6.67%.
Breaking Down Analyst Ratings: A Detailed Examination
In examining recent analyst actions, we gain insights into how financial experts perceive FormFactor. The following summary outlines key analysts, their recent evaluations, and adjustments to ratings and price targets.
| Analyst |
Analyst Firm |
Action Taken |
Rating |
Current Price Target |
Prior Price Target |
| Brian Chin |
Stifel |
Raises |
Hold |
$35.00 |
$31.00 |
| Craig Ellis |
B. Riley Securities |
Raises |
Buy |
$47.00 |
$34.00 |
| Elizabeth Sun |
Citigroup |
Lowers |
Neutral |
$31.00 |
$36.00 |
| Brian Chin |
Stifel |
Lowers |
Hold |
$31.00 |
$34.00 |
Key Insights:
- Action Taken: Analysts respond to changes in market conditions and company performance, frequently updating their recommendations. Whether they 'Maintain', 'Raise' or 'Lower' their stance, it reflects their reaction to recent developments related to FormFactor. This information offers a snapshot of how analysts perceive the current state of the company.
- Rating: Analyzing trends, analysts offer qualitative evaluations, ranging from 'Outperform' to 'Underperform'. These ratings convey expectations for the relative performance of FormFactor compared to the broader market.
- Price Targets: Understanding forecasts, analysts offer estimates for FormFactor's future value. Examining the current and prior targets provides insight into analysts' changing expectations.
Understanding these analyst evaluations alongside key financial indicators can offer valuable insights into FormFactor's market standing. Stay informed and make well-considered decisions with our Ratings Table.
Stay up to date on FormFactor analyst ratings.
All You Need to Know About FormFactor
FormFactor Inc is a provider of electrical and optical test and measurement technologies along the full semiconductor product lifecycle - from characterization, modeling, reliability, and design de-bug, to qualification and production test.. The company operates in two reportable segments namely Probe Cards Segment and the Systems Segment. Sales of probe cards and analytical probes are included in the Probe Cards Segment, while sales of probe stations and thermal sub-systems are included in the Systems Segment. Probe cards generate the maximum revenue from its operations. It offers multiple product lines which include analytical probes, probe stations, thermal sub-systems, and related services.
Key Indicators: FormFactor's Financial Health
Market Capitalization Analysis: Falling below industry benchmarks, the company's market capitalization reflects a reduced size compared to peers. This positioning may be influenced by factors such as growth expectations or operational capacity.
Negative Revenue Trend: Examining FormFactor's financials over 3M reveals challenges. As of 30 June, 2025, the company experienced a decline of approximately -0.85% in revenue growth, reflecting a decrease in top-line earnings. When compared to others in the Information Technology sector, the company faces challenges, achieving a growth rate lower than the average among peers.
Net Margin: FormFactor's net margin is impressive, surpassing industry averages. With a net margin of 4.64%, the company demonstrates strong profitability and effective cost management.
Return on Equity (ROE): The company's ROE is below industry benchmarks, signaling potential difficulties in efficiently using equity capital. With an ROE of 0.93%, the company may need to address challenges in generating satisfactory returns for shareholders.
Return on Assets (ROA): FormFactor's ROA is below industry standards, pointing towards difficulties in efficiently utilizing assets. With an ROA of 0.78%, the company may encounter challenges in delivering satisfactory returns from its assets.
Debt Management: FormFactor's debt-to-equity ratio is below the industry average at 0.04, reflecting a lower dependency on debt financing and a more conservative financial approach.
What Are Analyst Ratings?
Analyst ratings serve as essential indicators of stock performance, provided by experts in banking and financial systems. These specialists diligently analyze company financial statements, participate in conference calls, and engage with insiders to generate quarterly ratings for individual stocks.
Some analysts publish their predictions for metrics such as growth estimates, earnings, and revenue to provide additional guidance with their ratings. When using analyst ratings, it is important to keep in mind that stock and sector analysts are also human and are only offering their opinions to investors.
Breaking: Wall Street's Next Big Mover
Benzinga's #1 analyst just identified a stock poised for explosive growth. This under-the-radar company could surge 200%+ as major market shifts unfold. Click here for urgent details.
This article was generated by Benzinga's automated content engine and reviewed by an editor.
Posted In: FORM


