GS Acquisition Holdings Shares Rally: Technical Levels To Watch
Author: Tyler Bundy | April 06, 2021 06:01pm
Shares of the special purposes acquisition company GS Acquisition Holdings Corp. (NYSE:GSAH) shares gained ground Tuesday, closing 3.53% higher at $10.85.
Here's a look at the technical levels for the SPAC stock. 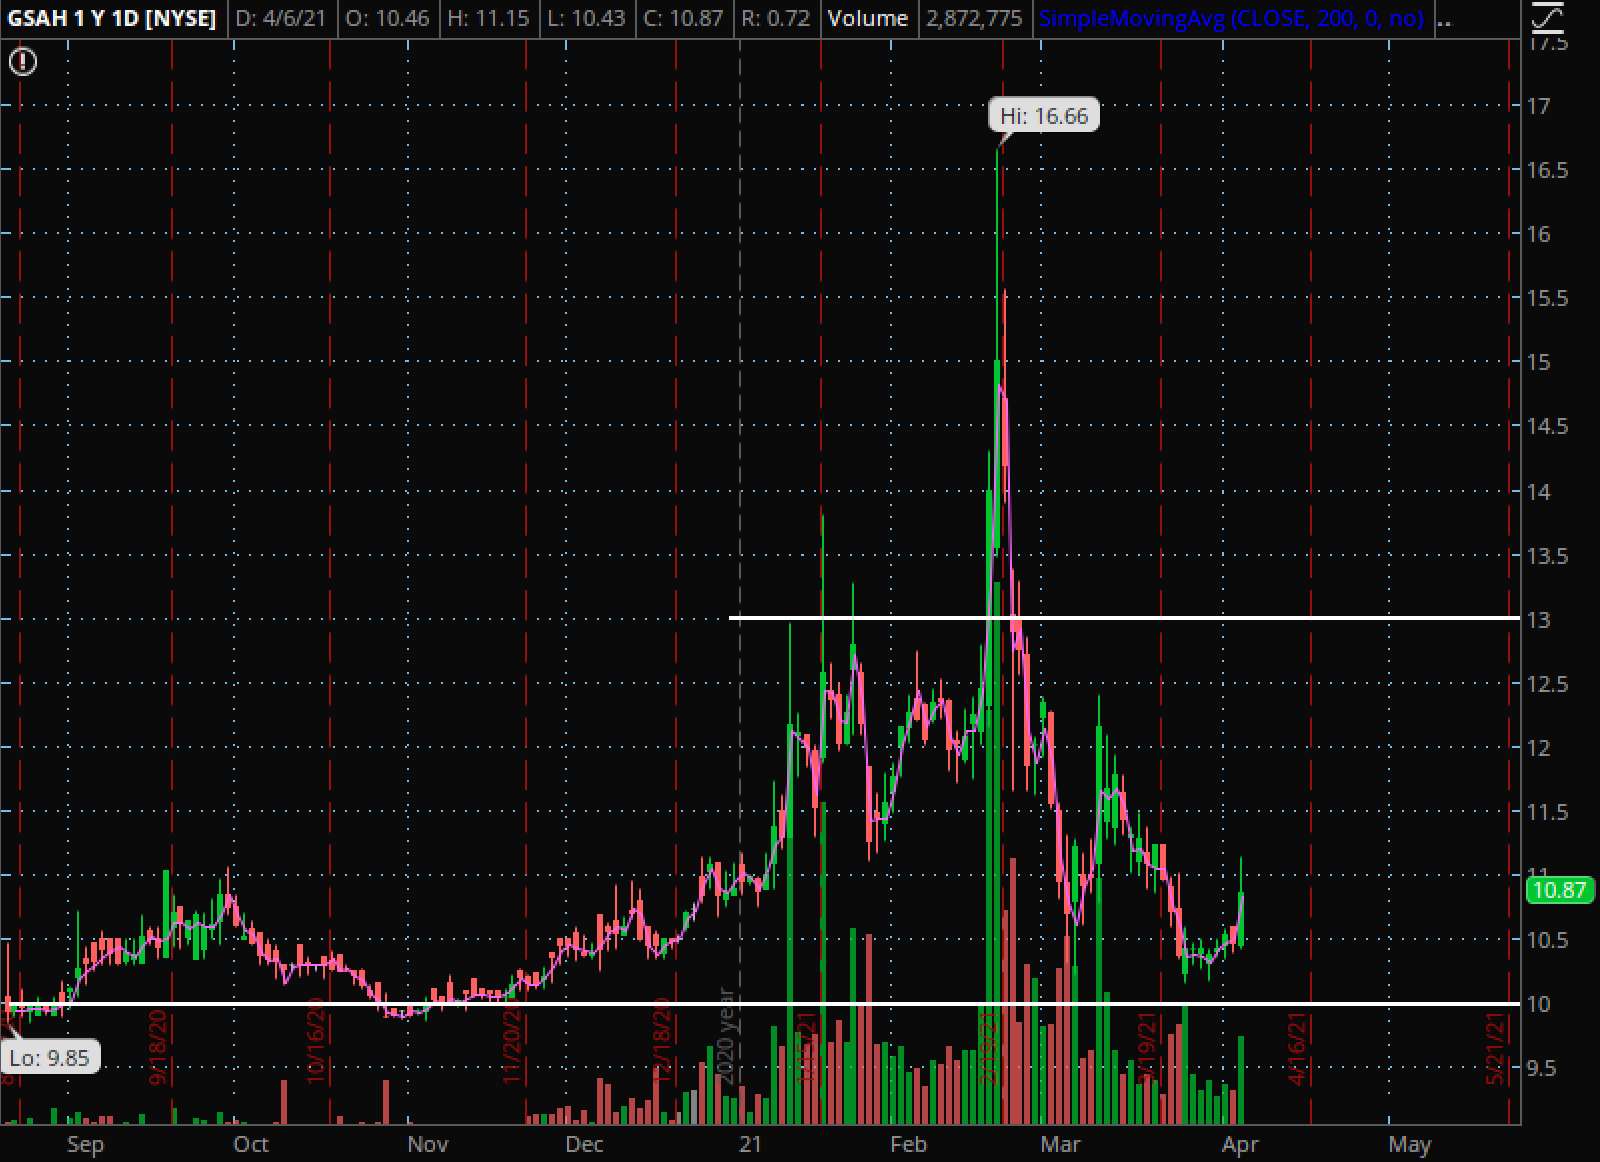
GS Acquisitions Daily Chart Analysis: The stock looks to be trading in a channel and possibly bounced off a support level.
The stock is showing two potential key price levels. The first is at the bottom of the channel near $10. This price level has acted as support multiple times in the past and may hold as support again in the future.
The second key level is at the top of the channel near the $13 level. This is an area where the price has struggled to get over and hold in the past. This area may hold again as resistance in the future.
Another interesting sight for traders is how the stock had increased volume throughout the past three months. The increase in volume could bring more volatile price movements and opportunity for profit.
What’s Next: Bullish technical traders would like to see the stock build higher lows and eventually cross above the resistance line. If the stock crosses above the resistance line and consolidates, it could move higher.
Bearish technical traders would like to see the stock fail to break above the resistance level. They would then like to see the stock cross below the support level with some consolidation before the stock moves down.
Posted In: GSAH