3 Penny Stocks With Head And Shoulders Patterns
Author: Mark Putrino | April 16, 2021 02:33pm
Seller's remorse is a common occurrence in the financial markets. It can be seen on almost any chart.
It happens when an investor sells a stock only to watch it move higher. The remorseful investor decides to buy it back, but only if they can get it for the same price they sold at.
This results in these remorseful sellers placing buy orders at the same price level they sold at. If there are enough of these buy orders, it creates support. This bullish dynamic sets the stage for another move higher.
Understanding this can lead to great profits. It's also the key to understanding the head and shoulders pattern.
When markets are rallying, there are so many remorseful sellers placing buy orders at their prior selling price that it causes support levels to form. Levels that had previously been resistance convert into support.
The first sign that the bull market is coming to an end is when this conversion dynamic ends. When the peak or resistance level that formed the left shoulder of a head and shoulders pattern doesn't convert into support, it's a bearish signal.
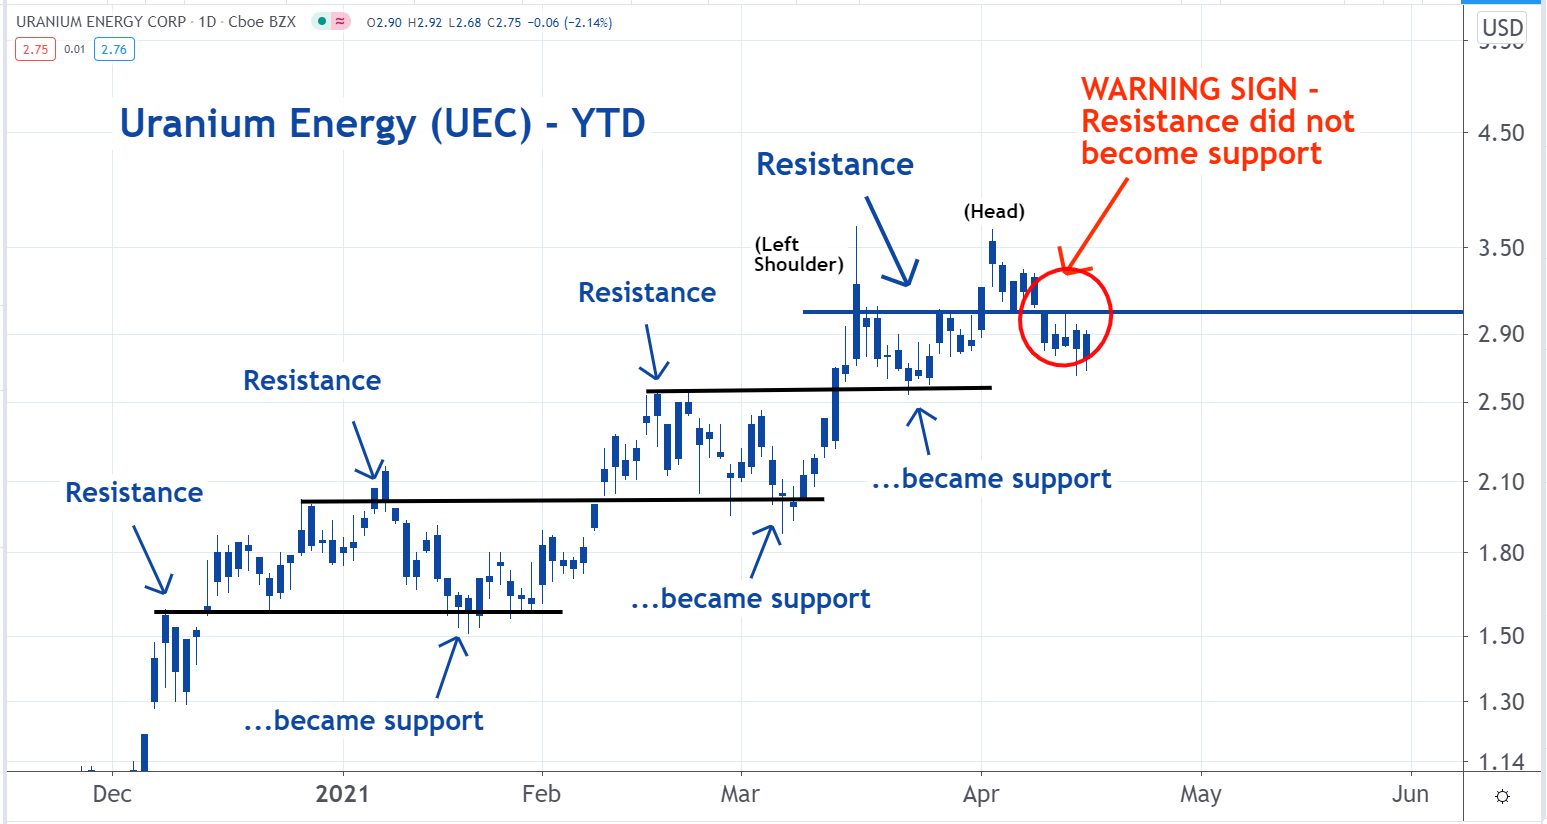
As Uranium Energy Corporation (NYSE:UEC) rallied from December through early April, there were three clear examples of levels that had been resistance converting into support. But now there is a warning signal.
The resistance around the $3 level that caused the left shoulder to form has not converted into support, which is a bearish dynamic.
It may be a sign that the uptrend in this stock has ended.
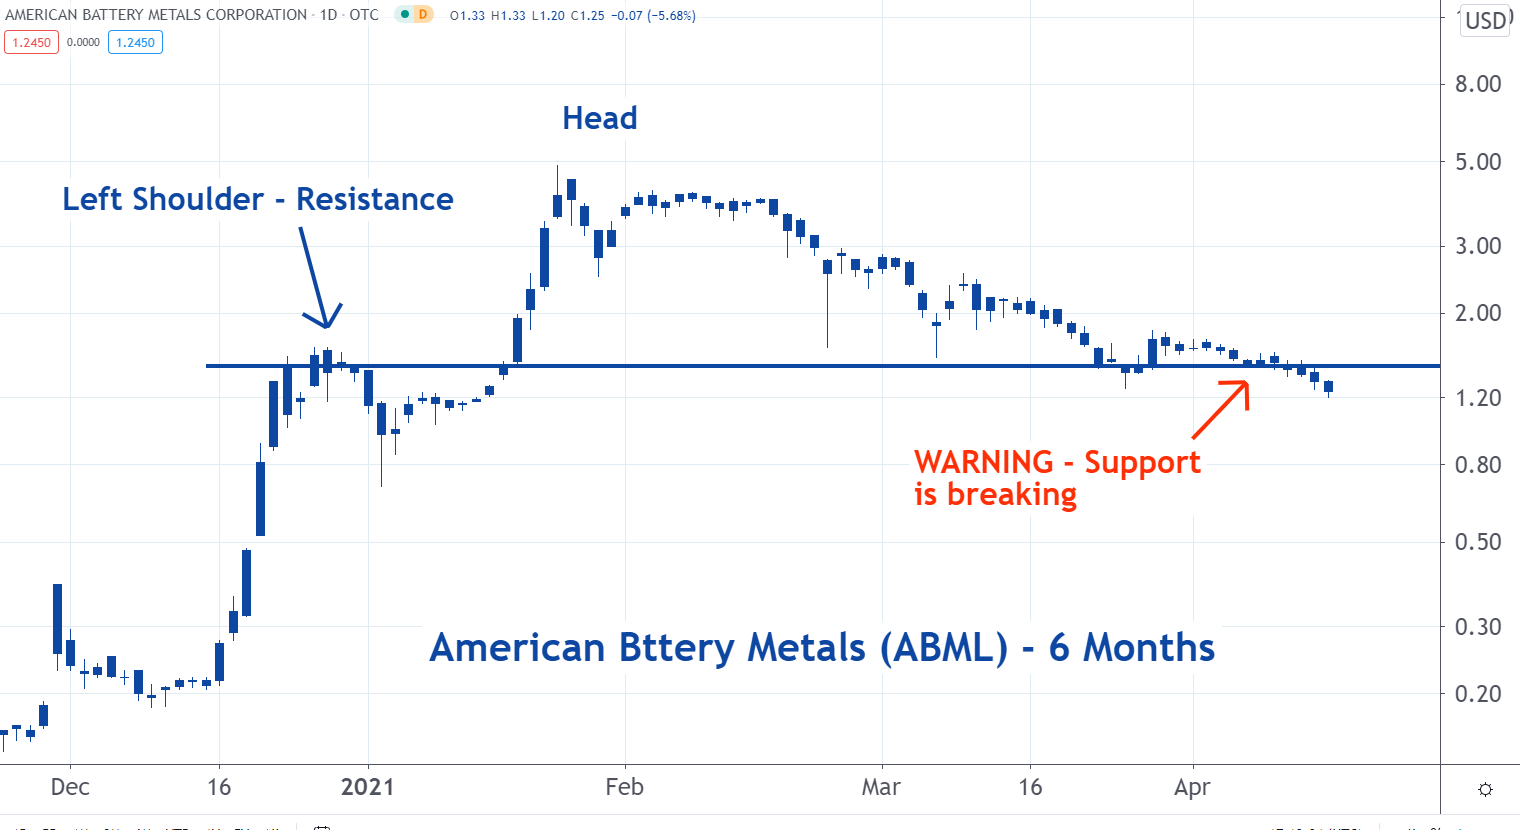
There was resistance for American Battery Metals Corporation (OTC:ABML) around $1.50 in December. This resistance formed the left shoulder of the pattern.
After forming the head of the pattern in January and February, shares have trended lower. There was support at the $1.50, but it has broken. The downtrend continues.
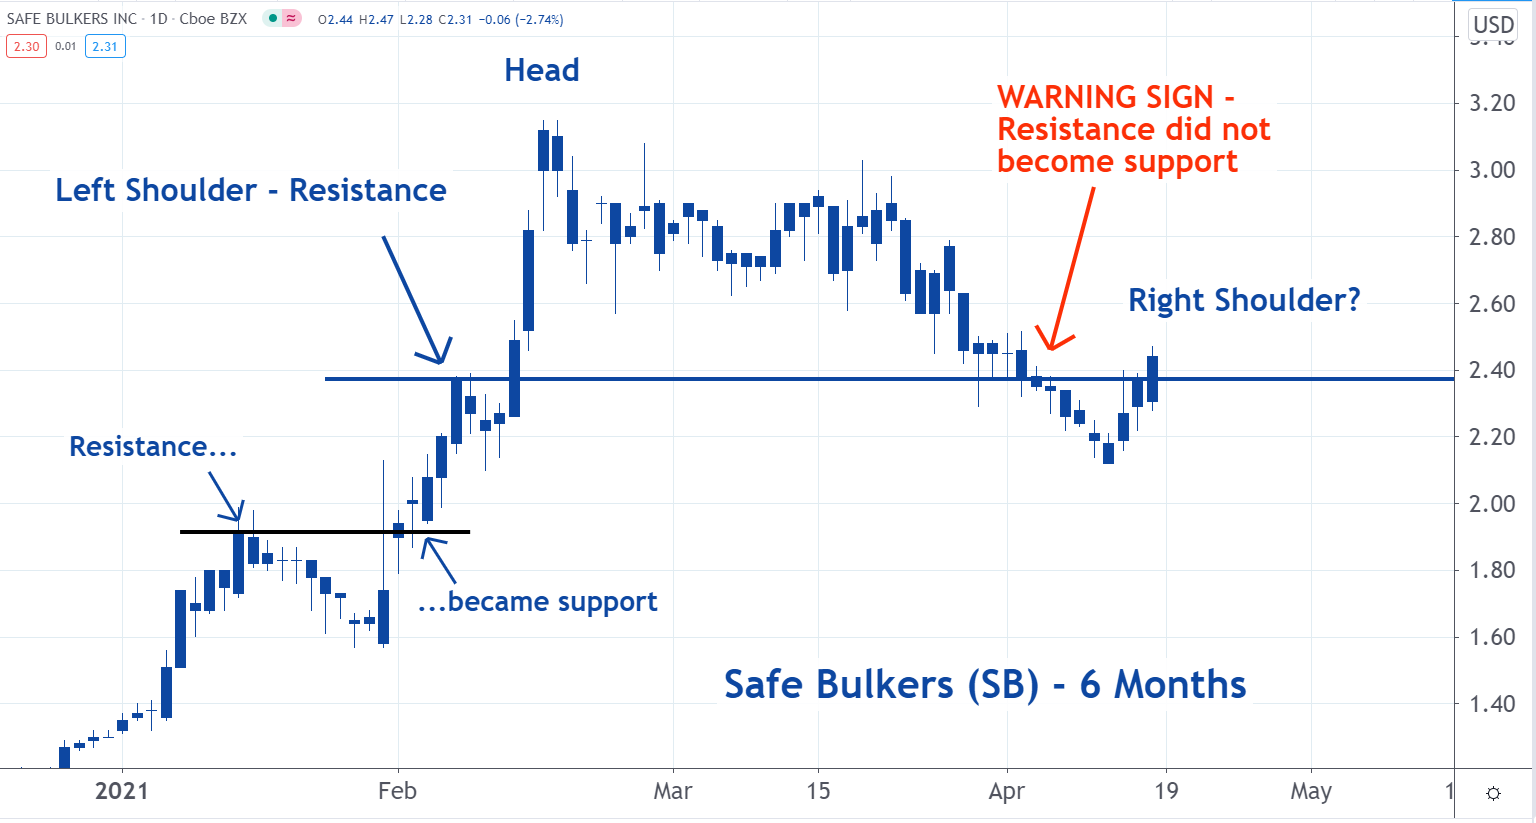
The resistance Safe Bulkers, Inc. (NYSE:SB) hit around the $1.90 level in January converted into support in early February.
After rallying off this level, the stock hit resistance at the $2.40 level. This resistance was the left shoulder of the pattern.
After breaking through $2.40, the head of the pattern formed around $3.10.
Then the stock trended lower and there was little if any support when it reached the $2.40 level.
Now the right shoulder is forming. These bearish dynamics suggest the downtrend will continue.
Posted In: ABML SB UEC