Quick Take Technical Analysis: Square, Inc
Author: Melanie Schaffer | December 10, 2021 03:36pm
Square, Inc (NYSE:SQ) is one of the 25 holdings on the new Roundhill MEME ETF (NYSE:MEME). The stock has been pressured downward recently due to the falling price of Bitcoin (CRYPTO: BTC). The steep decline may also be related to Square’s Nov. 4 third-quarter earnings print, where the company reported its revenue from Bitcoin fell over 33% from the previous quarter.
- Square is trading in a consistent downtrend by making a series of lower lows and lower highs on the daily chat, with the most recent lower low printing on Dec. 6 at $170.75 and the most recent lower high created at the $195.28 mark on Wednesday.
- On Friday, the stock was looking to print a bearish Marubozu candlestick, which could indicate lower prices may come on Monday.
- On Dec. 6 when Square tested the $170 level as support, it ran into dip buyers and bounced up from the level. The level is a key support because the stock hasn’t traded below it since Nov. 4, 2020.
- Traders can watch for Square to potentially retest the key level as support and create a bullish double bottom pattern.
- The eight-day exponential moving average is another key level to watch as it has been pressuring the stock down since Oct. 29. Bullish traders may want to wait until Square closes a trading session above the eight-day before feeling confident a reversal may be in the cards.
- Square has resistance above at $182.24 and $192.21 and support below at $170.46 and near the $155 level.
Want direct analysis? Find me in the BZ Pro lounge! Click here for a free trial.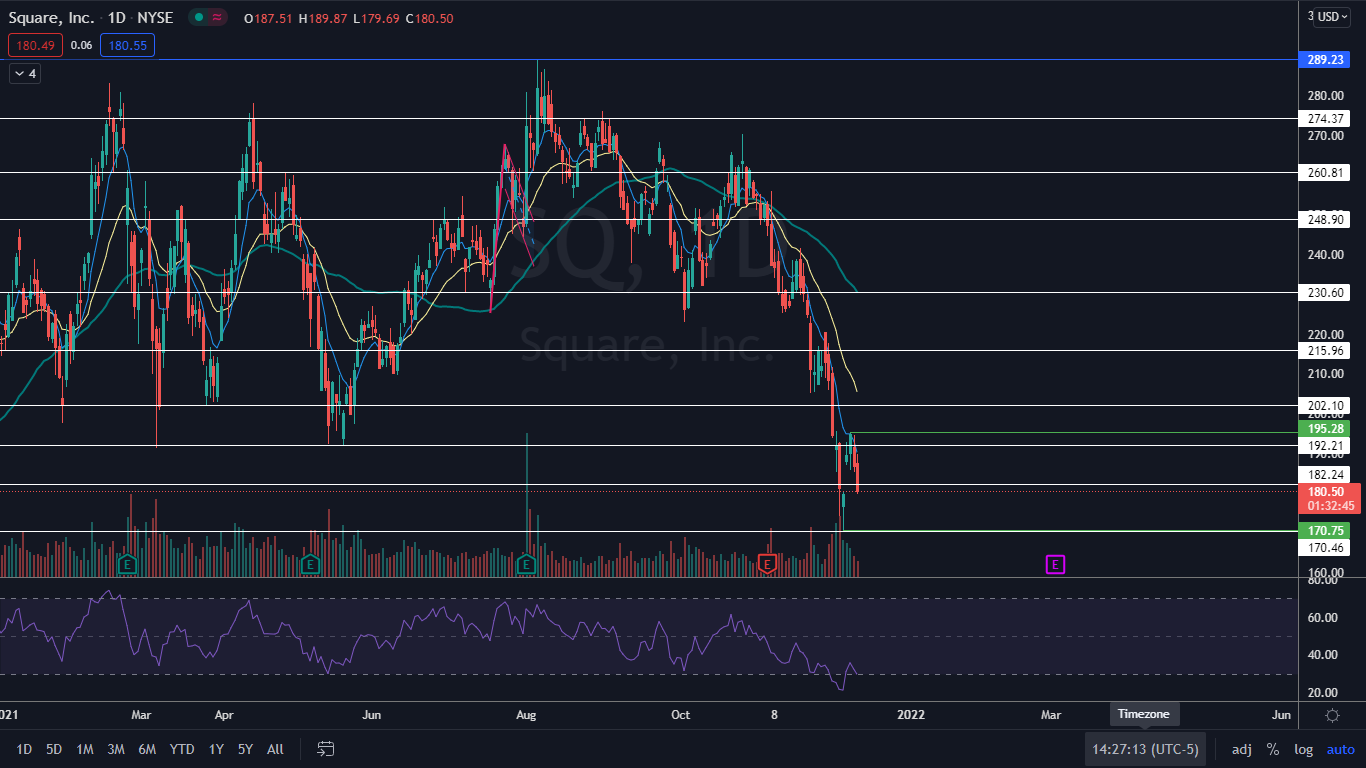
Posted In: $BTC MEME SQ


