What The Fed's Balance Sheet Reduction Will Mean For The S&P 500
Author: Wayne Duggan | February 15, 2022 12:36pm
The SPDR S&P 500 ETF Trust (NYSE:SPY) is off to a shaky start to 2022, down 5.1% year-to-date.
Investors are rightfully concerned about the potential for Federal Reserve interest rate hikes starting as soon as March, but history suggests the Fed's plan to begin reducing its balance sheet could be even more of a bearish catalyst for stock prices than rising rates.
Balance Sheet Expansion: The Federal Reserve's balance sheet roughly doubled in size to an unprecedented $9 trillion during the pandemic thanks to aggressive monthly bond and mortgage-backed security purchases. That buying has contributed to elevated inflation levels and high stock market valuations.
The Fed has hinted it will begin its "quantitative tightening" process in the near future, but the last time the Federal Reserve sold assets, it didn't go well for stock market investors.
Prior to the financial crisis in late 2008, The Fed held less than $1 trillion in assets on its balance sheet. From Sept. 15, 2008 to Jan. 15, 2015, the Fed increased its balance sheet holdings to $4.51 trillion. During that same stretch, the S&P 500 gained 65.7%.
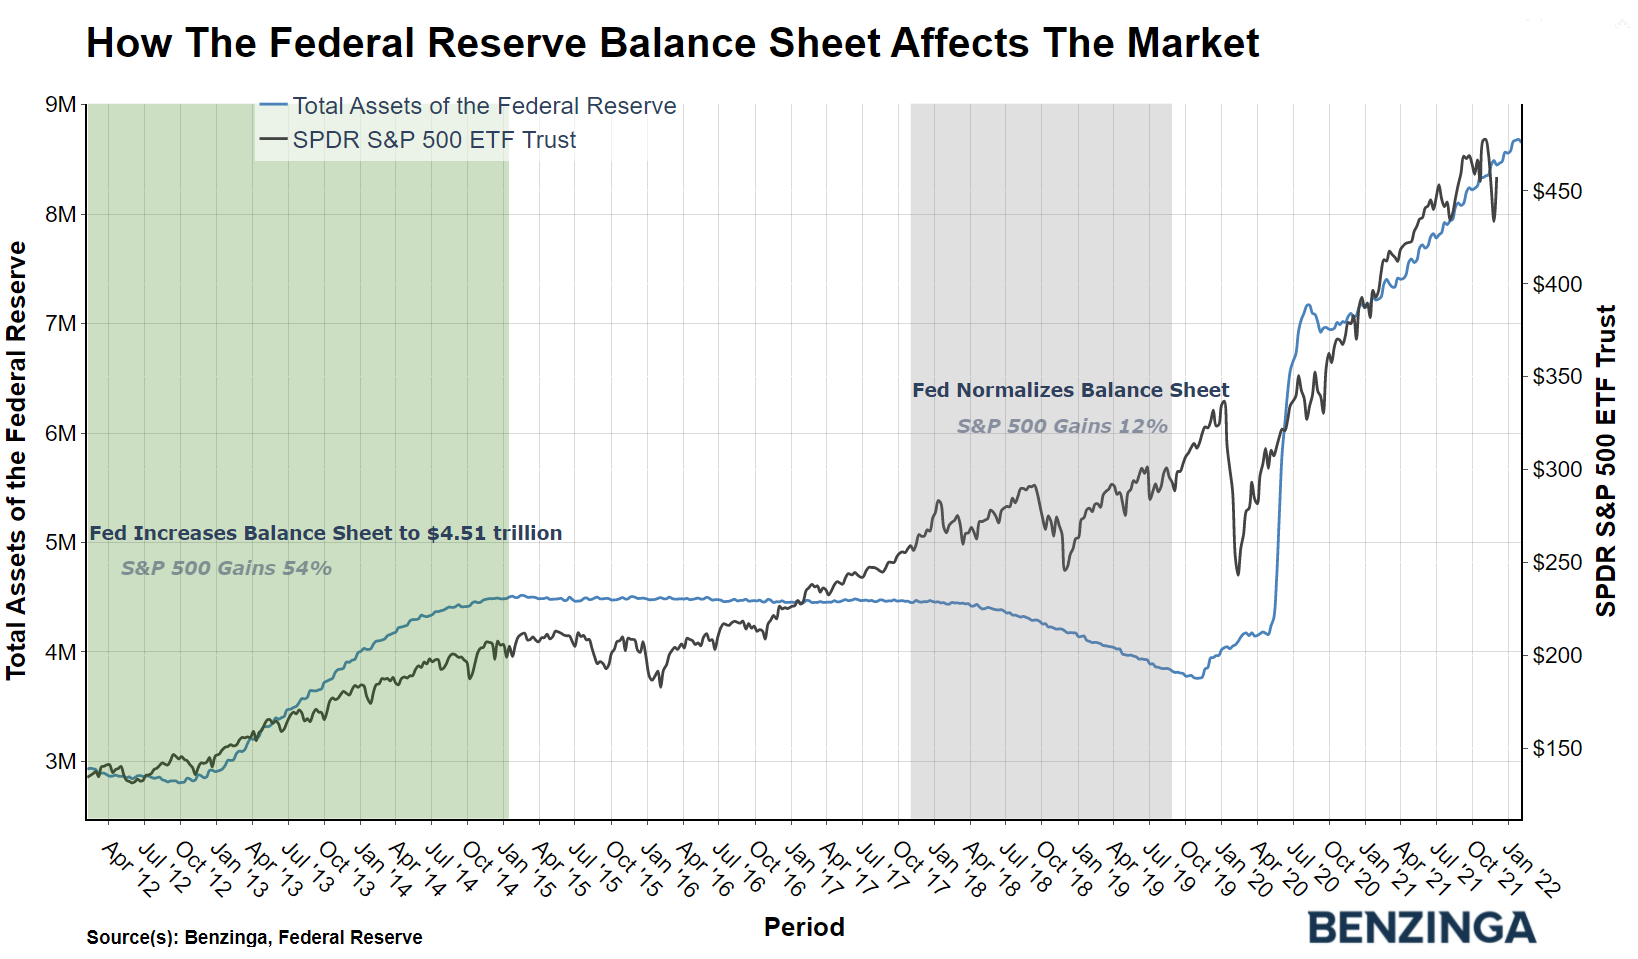
The Fed began its "balance sheet normalization" process in October 2017, allowing bonds to mature without reinvesting the repaid principal into new securities. That process continued through Aug. 26, 2019, reducing the Fed's balance sheet to around $3.76 trillion. During that previous stretch of tightening, the S&P 500 gained just 12.1%.
Related Link: US Adds 467,000 Jobs In January: 'Good For The Economy, But Not For Markets'
Sector Performance: Some sectors of the market struggled during the previous tightening period more than others. The Utilities Select Sector SPDR Fund (NYSE:XLU) more than doubled the S&P 500's return during the previous tightening period, generating a total return of 30.6%. The Real Estate Select Sector SPDR Fund (NYSE:XLRE) was also a top performer, generating a total return of 27.9%. On the other end of the spectrum, the Energy Select Sector SPDR Fund (NYSE:XLE) generated a negative total return of 23.3% during quantitative tightening, while the Materials Select Sector SPDR Fund (NYSE:XLB) generated a negative total return of 6.3%.
Growth and dividend stocks outperformed during the period. The Vanguard Growth Index Fund ETF (NYSE:VUG) generated a total return of 22.7%, while the Vanguard Dividend Appreciation Index Fund ETF (NYSE:VIG) produced a 24.2% total return.
Small-cap stocks and value stocks underperformed during the previous balance sheet run-off. The Vanguard Value Index Fund ETF (NYSE:VTV) generated just a 9.8% total return, while the Vanguard Small-Cap Index Fund ETF (NYSE:VB) generated an 8.1% total return.
Benzinga's Take: The biggest difference between the upcoming Fed tightening cycle and the previous one may happen if the Fed actually sells assets rather than simply letting them mature and run off naturally. Asset sales could drain bank balance sheet liquidity and potentially pressure both the credit market and stock market valuations, according to Credit Suisse.
Posted In: SPY VB VIG VTV VUG XLB XLE XLRE XLU