Friday's CPI Print And Recent Price Action Suggest The Market Is Following A 1970's Analog. Bullish For Oil, Bearish For Tech.
Author: David Pinsen | June 13, 2022 10:04am
That '70s Show
In the wake of Friday's soaring CPI print and Bank of America strategist Michael Hartnett's latest note ("A Dire Outlook From Wall Street's Biggest Bear"), it's worth revisiting the '70s bear market analogue he sketched out last month, and how that has panned out so far.
As ZeroHedge summarized it at the time,
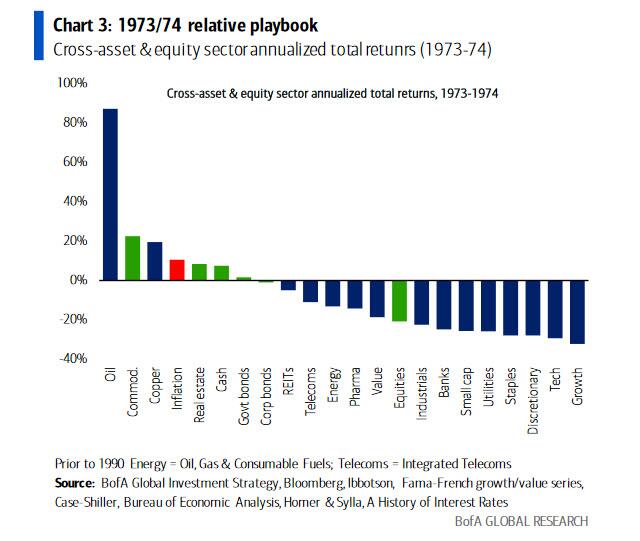
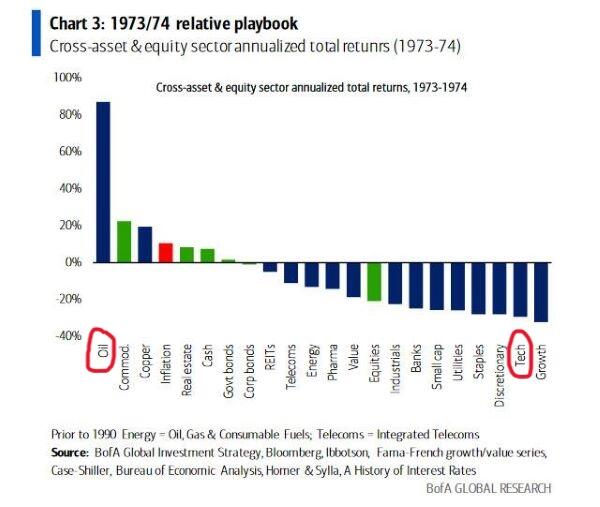
[For] Hartnett, the correct relative playbook is 1973/74 and it shows that cash and commodities beat bonds & stocks (esp consumer & tech; note Big Tech starting to ape Nifty 50 crash).
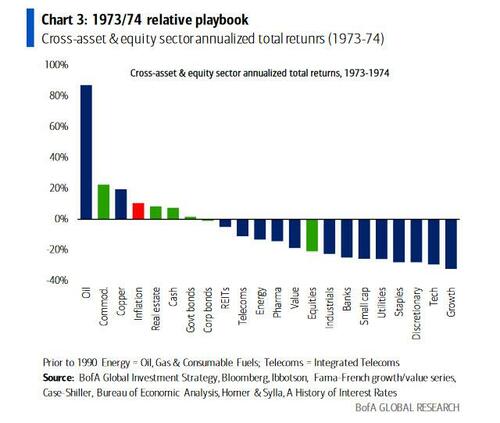
In our post at the time (That '70s Show), we drew particular attention to the chart above.
The stagflation and bear market of the '70s but instead of détente, the nuclear brinksmanship of the early '60s. $OIH $USO $MOS $TECS https://t.co/TJ0U95TlIa
— Portfolio Armor (@PortfolioArmor) May 8, 2022
Positioning for an Early '70s Redux
As we wrote then, referencing the 1973/1974 relative playbook,
Take a look at the chart above and note that the best performing sector in 1973/74 was oil, and the second-worst was tech (at the time, the Arab oil embargo in the wake of the Yom Kippur War played a similar role in limiting supply that Western sanctions on Russia have in the wake of the Ukraine War).
..
[Our] system doesn't consider the macro picture when selecting its top names. Instead, it gauges underlying securities and options market sentiment to estimate which names are likely to perform the best over the next six months. Nevertheless, that bottoms-up approach often reflects a macro picture, and the picture our system painted with Friday's top ten names bears a striking resemblance to Hartnett's '73-'74 analog:

Screen capture via Portfolio Armor on 5/6/2022.
Recall that oil was the top performing sector during the '70s bear market. On Friday, four of our top ten names were oil names: ProShares Ultra Bloomberg Crude Oil (NYSE:UCO), United States Brent Oil Fund LP (NYSE:USO), United States Oil Fund LP (NYSE:USO), and VanEck Vectors Oil Services (OIH). Three of our other long names were in energy, ProShares Ultra Bloomberg Natural Gas (NYSE:BOIL), United States Natural Gas Fund LP (NYSE:UNG), and Peabody Energy Corp. (NYSE:BTU); our eighth long name was in fertilizer, The Mosaic Co. (NYSE:MOS); and our top ten was rounded out with two short names, ProShares Short Russell2000 (NYSE:RWM), and Direxion Daily Technology Bear 3x Shares (NYSE:TECS).
The '70s Market Analog A Month Later
A month later, and here's how our top ten names from May 6th are doing.

Our top performing name so far is the levered crude oil ETF UCO, and our third-best performer is the levered short bet on tech, TECS, which is consistent with the 1973-1974 relative value playbook.

A Word Of Warning
Although oil names have continued their climb, Hartnett warned that resources stocks may get sold off as the market hits its bear market low:
And with the market on its way to said lows, the BofA strategist warns that the most vulnerable assets to own are Big Tech (positioning, secular loser), REITs (inflation hedge), resources (they are in secular bull but at lows investors forced to sell winners), and US dollar (will discount peak yields).
Readers may want to consider hedging their long positions in oil.
Posted In: BOIL BTU MOS RWM TECS UCO UNG USO