How To Profit From Amazon Stock's Historic Collapse On Earnings? Hint: It's An ETF
Author: Melanie Schaffer | October 28, 2022 11:23am
Direxion Daily AMZN Bear 1X Shares (NYSE:AMZD) gapped up over 11% on Friday after a big bullish day on Thursday caused the ETF to rally 4%.
AMZD is an inverse single stock ETF that provides daily returns of 100% of the inverse performance of Amazon.com, Inc (NASDAQ:AMZN). Although the fund tracks the movement of Amazon inversely, high volatility in Amazon can affect AMZD returns more than in Amazon.
What’s Up With Amazon? Amazon plunged over 11% to start the trading day after printing mixed third-quarter earnings and providing fourth-quarter guidance that came in well below expectations.
The company reported EPS of 28 cents, beating the Street estimate of EPS of 22 cents. Amazon’s revenue came in at $127.1 billion, missing the consensus estimate of $127.84.
For the fourth quarter, Amazon guided revenue to come in between $140 billion to $148 billion versus an analyst estimate of $155.15 billion.
Single Stock ETFs: ETFs that only track one security are riskier than other leveraged or inverse funds because they don’t offer diversification.
Similar to leveraged index funds, single stock ETFs should only be expected to track the underlying stock(s) for a single day. For example, when volatility in Amazon decreases, AMZD could trade flat or even drop when Amazon trades lower.
For traders who want to play Amazon bullishly, Direxion Daily AMZN Bull 1.5X Shares (NYSE:AMZU) offers 150% daily leveraged investment results to that of Amazon.
It should be noted that leveraged and/or inverse ETFs are meant to be used as a trading vehicle as opposed to a long-term investment.
Want direct analysis? Find me in the BZ Pro lounge! Click here for a free trial.
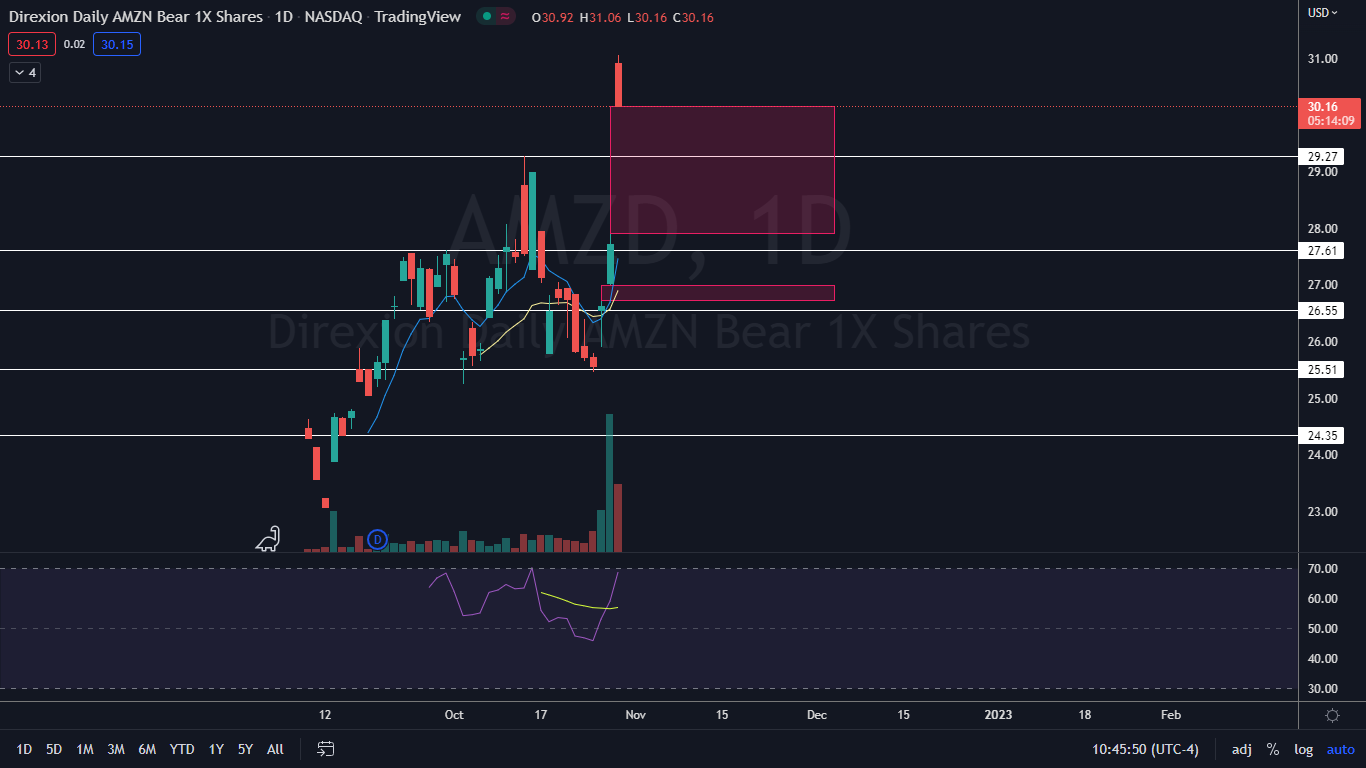
The AMZD Chart: AMZD is a new investment vehicle that began trading on Sept. 8. Since Tuesday’s closing price, AMZD has surged about 20% compared to Amazon, which has plunged about 18%.
- AMZD has two gaps below on the chart, left behind on Thursday and Friday. Gaps on charts fill about 90% of the time, which makes it likely the ETF will decline significantly to fill both gaps at some point.
- After Amazon’s huge slide, sideways consolidation is likely to take place in the stock, which will likely cause AMZD to fall. Eventually Amazon will bounce up to at least print a lower high, which will definitely cause AMZD to decline.
- AMZD has support below at $28.27 and $27.61. The ETF doesn’t have any of its own resistance above outside of Friday’s high-of-day at $31.06, which corresponds roughly to support Amazon has near $98.
 See Also: Single-Stock ETFs Are On The Rise — Understand These Core Principles Before Investing
Photo via Shutterstock.
Posted In: AMZD AMZN AMZU