Looking To Trade A Reversal In Retail Stocks? This ETF Tracks Amazon, Target, Dollar Tree, Among Others
Author: Melanie Schaffer | November 16, 2022 03:02pm
The Direxion Daily Retail Bull 3X Shares (NYSE:RETL) was plunging more than 11% lower on Wednesday after Target Corporation (NYSE:TGT) reported a big EPS miss.
RETL is a triple-leveraged fund designed to outperform S&P Retail Select Industry Index by 300%. The index includes a variety of companies from apparel and automotive to specialty stores, food retail and department stores.
Some of the more familiar names in the ETF include Amazon.com, Inc. (NASDAQ:AMZN), weighted at 0.58%, Dollar Tree Inc (NASDAQ:DLTR), weighted at 0.91% and Target Corporation, which is weighted at 0.8% within the ETF.
It should be noted that leveraged ETFs are meant to be used as a trading vehicle as opposed to long-term investments.
RETL was likely slipping on Wednesday to account for a big decline in Target, and other retail stocks that slid in tandem after Target reported a massive miss on its bottom line.
Read how analysts responded to Target’s third-quarter earnings print here
Want direct analysis? Find me in the BZ Pro lounge! Click here for a free trial.
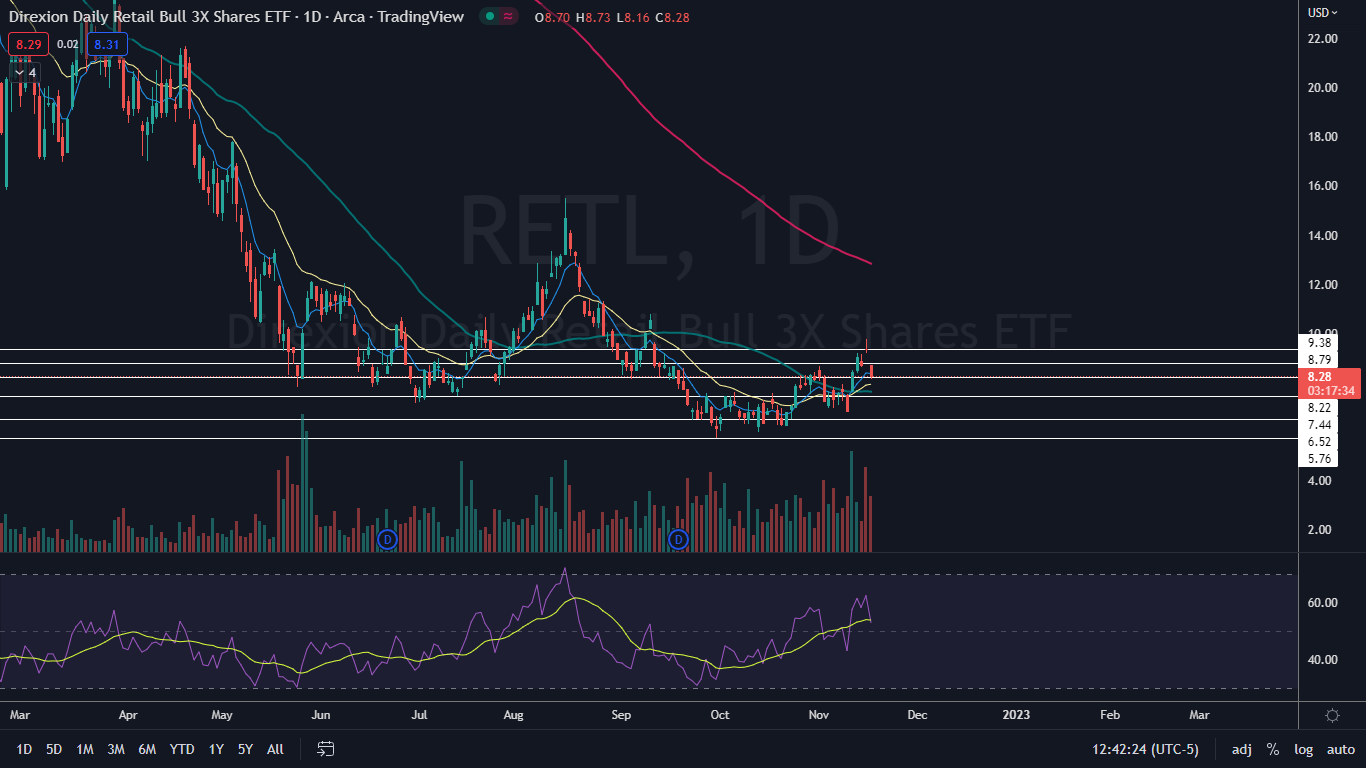
The RETL Chart: RETL started trading in a fairly consistent uptrend on Sept. 30, with the most recent higher high formed on Tuesday at $9.78 and the most recent confirmed higher low printed at the $6.78 mark on Nov. 9. On Wednesday, RETL was working to print a bearish kicker candlestick on the daily chart, which could indicate lower prices will come on Thursday.
- If lower prices are on the horizon, bullish traders will be watching for RETL to eventually print a bearish reversal candlestick, such as a doji or hammer candlestick, above $7 to indicate the uptrend is intact and higher prices are in the cards. If the ETF falls under $7 or prints a lower high under $10, the uptrend will be negated.
- Short-term bullish traders will want to see RETL bounce up to close Wednesday’s session above the eight-day exponential moving average (EMA), which could cause the stock to print a hammer candlestick to indicate higher prices will come on Thursday. If the ETF closes the trading day under the eight-day EMA, RETL may find support at the 50-day simple moving average.
- RETL has resistance above at $8.79 and $9.38 and support below at $8.22 and $7.44.
See Also: Jim Cramer Sees Rally Lasting At Least Through Mid-December: 'There's A Lot To Like About This Market'
Photo: solarseven via Shutterstock
Posted In: AMZN DLTR RETL TGT