Ford Stock Forms 2 Bullish Patterns Under This Indicator: Is A Bull Market On The Horizon?
Author: Melanie Schaffer | December 01, 2022 02:31pm
Ford Motor Company (NYSE:F) gapped up 1.37% to start Thursday’s trading session after a volatile session on Wednesday caused the stock to slip over 2% intraday before closing flat.
The legacy-turning-EV vehicle manufacturer announced it’s upping its total investment into Ford’s Halewood Plant on Merseyside, U.K. by £125 ($152.8 million U.S.) to aid its transformation into the EV space. This puts Ford’s total investment into the facility at £380 million.
See Also: Elon Musk Can't Help But Praise Tesla Rival Ford - Here's Why
"Our vision in Europe is to build a thriving business, by extending leadership in commercial vehicles and through the electrification of our car range," said Kieran Cahill, Ford's European Industrial Operations vice-president.
Ford met an EV milestone on Wednesday, announcing it had produced its 150,000th Mustang Mach-E. The news was met with congratulations from Tesla, Inc (NASDAQ:CEO) CEO Elon Musk, who’s EV company currently dominates the EV market share in the U.S.
As Ford continues to increase its EV offerings and ramp up production, its current 7% market share is sure to grow. From a technical perspective, Ford has settled into a bull flag pattern on the weekly chart, which could send the stock soaring over 30% if the market cooperates.
Want direct analysis? Find me in the BZ Pro lounge! Click here for a free trial.
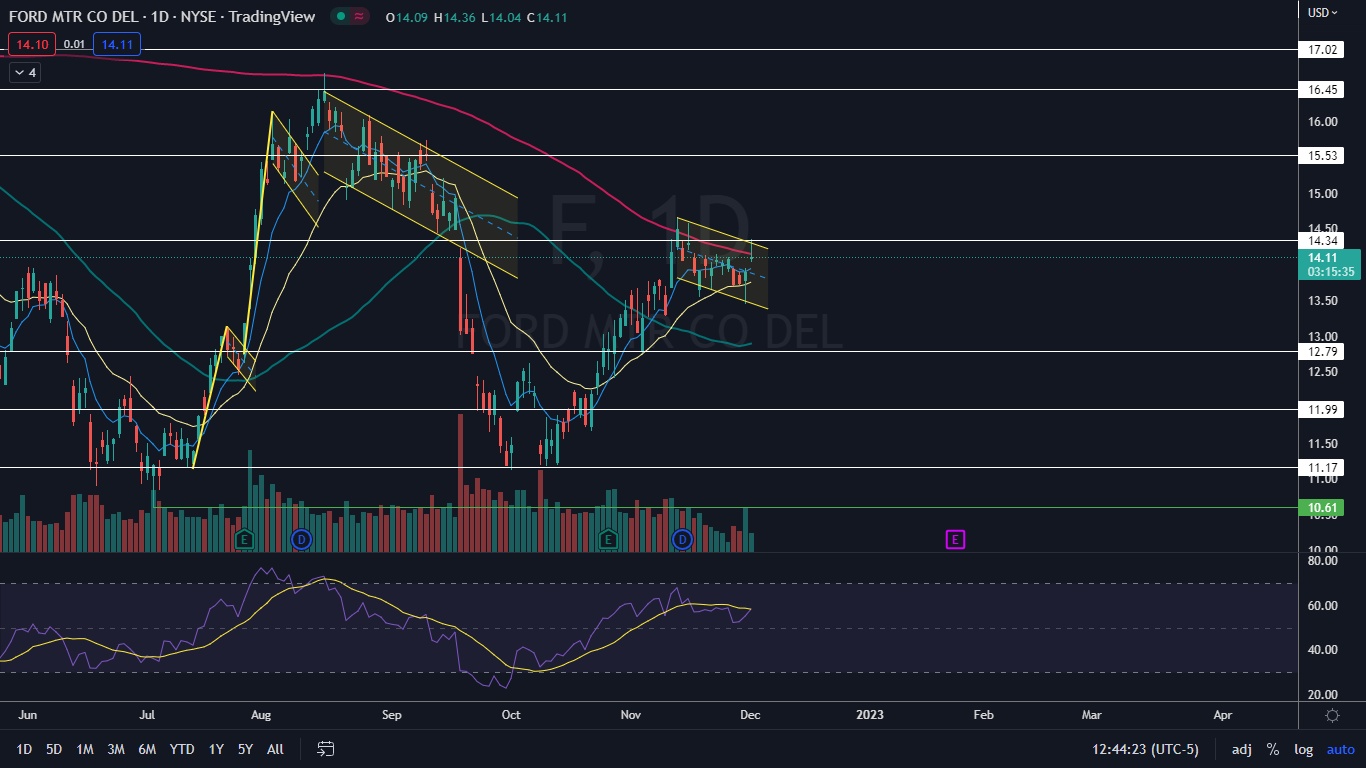
The Ford Chart: On the daily chart, Ford has been trading within a falling channel pattern since Nov. 11, which has developed just under the 200-day simple moving average (SMA). A falling channel pattern is considered to be bearish until a stock breaks up from the upper descending trendline of the pattern on higher-than-average volume, which Ford attempted to do on Thursday but failed.
- On the weekly chart, the falling channel, when paired with Ford’s 31% surge between Oct. 11 and Nov. 11, has set the stock into a bull flag pattern. When a bullish pattern develops on a large time frame, such as a the weekly chart, the move can take weeks to play out but can offer a higher degree of predictability.
- On Thursday, when Ford attempted to break up from the falling channel pattern and bull flag, the stock rejected the 200-day SMA. The 200-day SMA is an important bellwether indicator and a stock is unlikely to burst through the area on the first attempt. If Ford breaks up from the bullish patterns and reclaims the 200-day SMA as support, the stock will enter into a potential bull cycle.
- If Ford closes the trading session under the 200-day SMA, the stock will print a shooting star candlestick, which could indicate lower prices will come on Friday. If buyers come in later in the trading session and Ford closes near its high-of-day price, higher prices and confirmation of a bull flag break could be on the horizon.
- Ford has resistance above at $14.34 and $15.53 and support below at $12.79 and $11.99.
 Read Next: First US Auto Race Proves The Worth Of Horseless Buggies On This Day In Market History
Posted In: CEO F TSLA


