Looking To Trade The Gold Miner Sector Bullishly? This 2X Leveraged Fund May Be Reversing Course
Author: Melanie Schaffer | December 22, 2022 04:18pm
The Direxion Daily Gold Miners Index Bull 2X Shares (NYSE:NUGT) was trading down Thursday, in tandem with spot gold, which was declining about 1.5% to trade near the $1,785 mark.
The gold miners sector, which often moves in tandem with gold prices, recently enjoyed a bull cycle that began on Nov. 4 and caused NUGT to soar almost 68% higher between that date and Dec. 13. Since then, NUGT has entered a downtrend.
Since Dec. 1, gold has been trading near the 200-day simple moving average and the commodity most recently crossed above the level on Tuesday. On Thursday, gold was retracing to test the 200-day SMA as support. If it can hold above the area, NUGT could make another run north.
NUGT is a double leveraged fund that is designed to outperform the NYSE Arca Gold Miners Index. The ETF tracks a number of gold and silver mining companies through its holdings, with Dreyfus Government Cash Management Funds Institutional weighted at 62.34%.
It should be noted that leveraged ETFs are meant to be used as a trading vehicle as opposed to a long-term investment by experienced traders. Leveraged ETFs should never be used by an investor with a buy and hold strategy or those who have low risk appetites.
For traders who want to play the gold miners sector to the downside, Direxion offers Direxion Daily Gold Miners Index Bear 2X Shares (NYSE:DUST).
Want direct analysis? Find me in the BZ Pro lounge! Click here for a free trial.
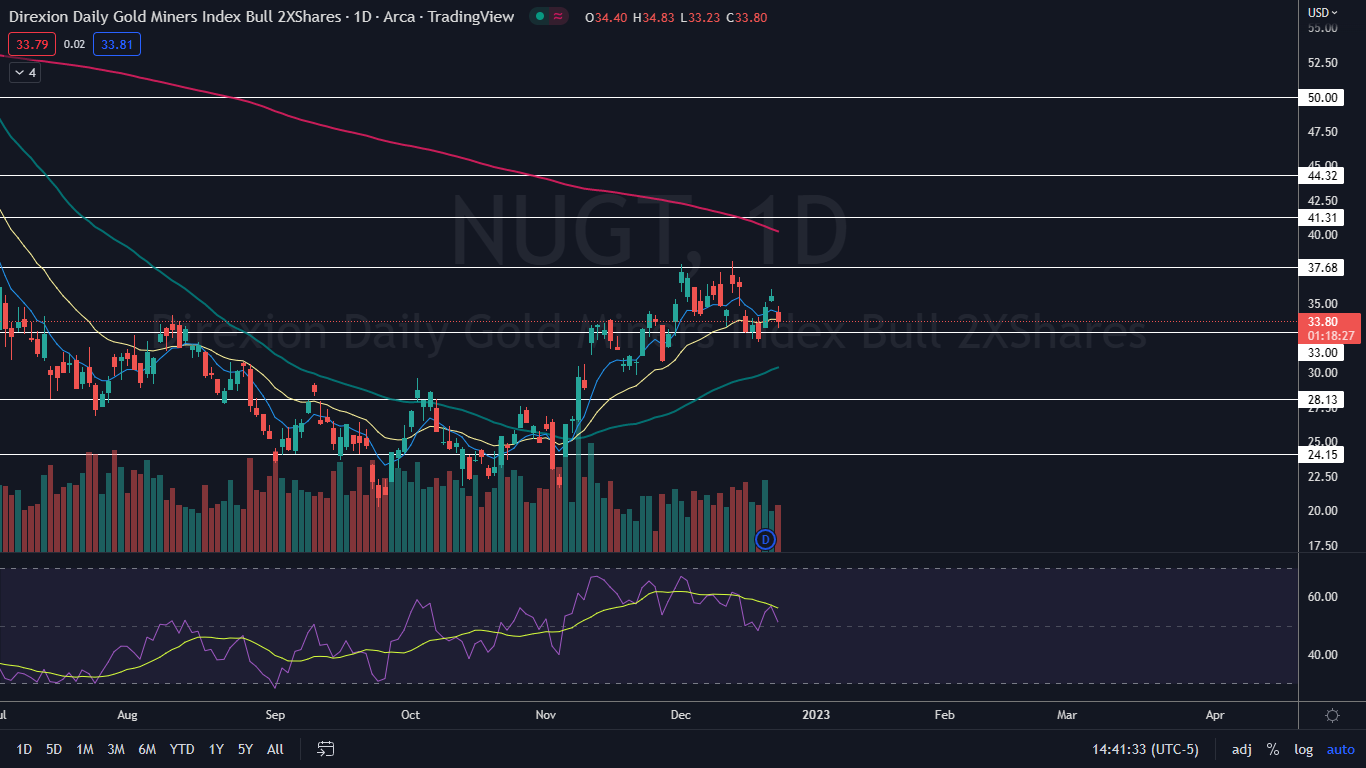
The NUGT Chart: NUGT reversed into a downtrend on Dec. 13, confirmed by printing a lower high at the $36.12 mark on Wednesday. On Thursday, the ETF fell lower but may have formed a higher low on the daily chart to negate the downtrend.
- On Thursday, NUGT was working to print a hammer candlestick on the daily chart, which could indicate higher prices are in the cards for Friday. If that occurs, traders would like to see the ETF surge up above $37, which would confirm a new uptrend.
- If NUGT trades higher on Friday, traders want to see the ETF regain the eight-day exponential moving average (EMA) as support. If the ETF can’t pop up above the level, the eight-day EMA will cross below the 21-day EMA, which would be bearish.
- NUGT has resistance above at $37.68 and $41.31 and support below at $33 and $28.13.
 Read Next: 2023 Predictions From Standard Chartered: Bitcoin $5,000, Gold Soars, And Trouble For Biden
Photo via Shutterstock.
Posted In: DUST NUGT