Looking To Trade The Oil And Gas Sector To The Downside? This 2X Leveraged ETF Formed This Pattern
Author: Melanie Schaffer | December 23, 2022 01:57pm
The Direxion Daily S&P Oil & Gas Exp & Prod Bear 2X Shares (NYSE:DRIP) declined about 5% Friday after Russian Deputy Prime Minister Alexander Novak told state-owned news channel Rossiya-24 that Russia could reduce its oil production by 500,000-700,000 barrels a day.
The news comes in response to the G7 price cap of $60-per-barrel on Russian crude oil enacted earlier this month.
Demand may also be waning globally, with China battling raging COVID-19 cases since it lifted restrictions.
See Also: Putin - 'Our Goal Is Not To Spin The Flywheel Of Military Conflict'
DRIP is a double-leveraged fund designed to outperform the inverse movement of companies held in the S&P Oil & Gas Exploration & Production Select Industry Index.
A few of the most popular companies held in the ETF are Exxon Mobil Corp (NYSE:XOM), which is weighted at 1.37% within the ETF; Occidental Petroleum Corporation (NYSE:OXY), weighted at 1.32%; and Marathon Oil Corporation (NYSE:MRO). It should be noted that leveraged ETFs are meant to be used as a trading vehicle as opposed to long-term investments.
For traders looking to play the oil and gas sector bullishly, Direxion offers the Direxion Daily S&P Oil & Gas Exp & Prod Bull 2X Shares (NYSE:GUSH)
Want direct analysis? Find me in the BZ Pro lounge! Click here for a free trial.
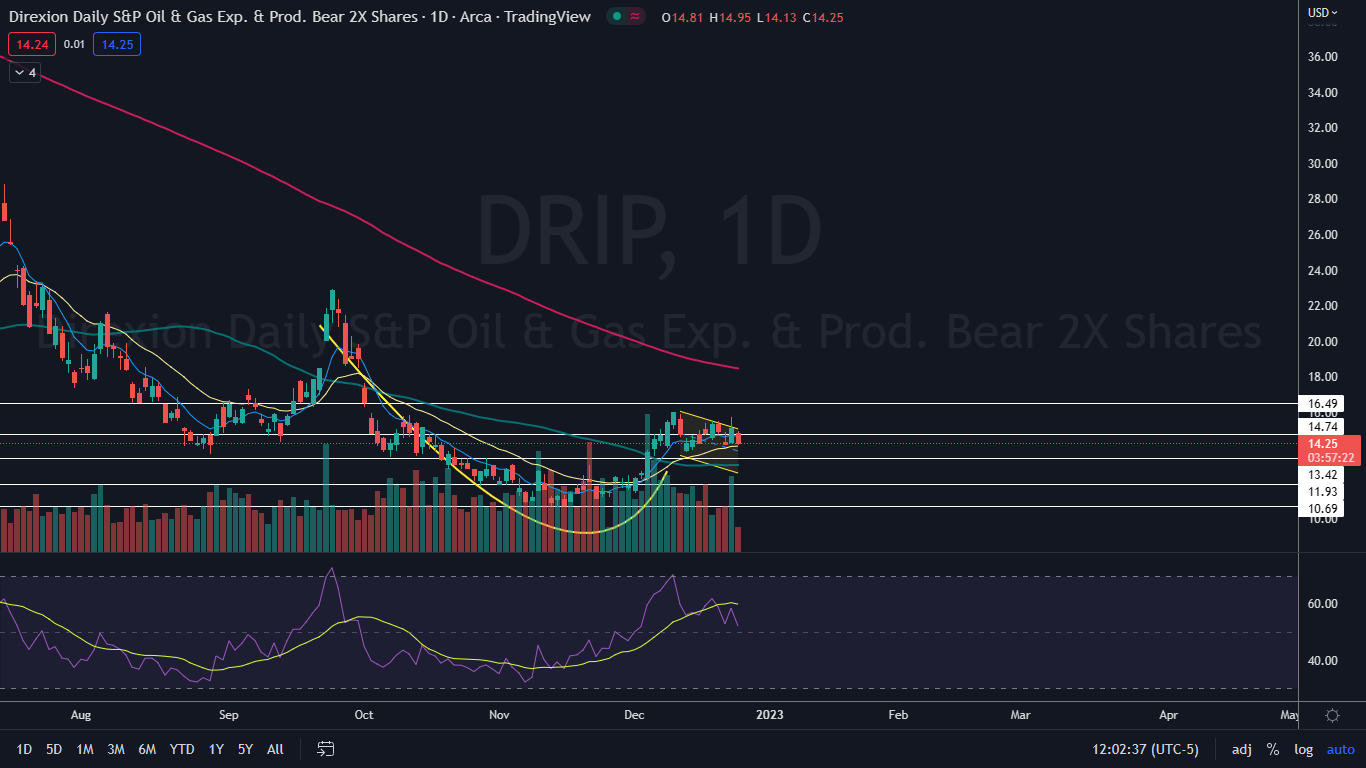
The DRIP Chart: Drip has formed a cup-and-handle pattern on the daily chart, with the rounded cup formation printed between Sept. 26 and Dec. 9 and the downward-sloping handle created over the trading days that have followed. The pattern is considered to be bullish and traders can watch for DRIP to eventually break up from the upper descending trend line of the handle on higher-than-average volume to gauge whether the pattern was recognized.
- DRIP is also trading in an inside bar pattern on the daily chart, with all of Friday’s price action taking place within Thursday’s trading range. The pattern is considered bullish in this case because the ETF negated its short-term downtrend within the handle pattern on Wednesday by printing a higher low.
- DRIP is trading above the 50-day simple moving average (SMA), which is bullish for the longer term but below the 200-day SMA. If DRIP breaks up bullishly from the cup-and-handle pattern, bullish traders will want to see the ETF surge up toward the 200-day SMA.
- DRIP has resistance above at $14.74 and $16.49 and support below at $13.42 and $11.93.
 Read Next: Not Exxon, Not Occidental — Indonesian Miner Adaro Is 2022's Best Performing Stock
Posted In: DRIP GUSH MRO OXY XOM