Bearish On The Stock Market Following SPY's Possible Double Top? This Fund Offers 3X Leverage
Author: Melanie Schaffer | May 29, 2023 07:12pm
The SPDR S&P 500 (NYSE:SPY) closed 1.3% higher on Friday, where the ETF wicked off resistance at $420.76, forming a possible triple top pattern when paired with similar price action on May 19.
Whether the market will continue in its current uptrend or reverse course, remains to be seen.
The current trend suggests the SPY is likely to trade higher. But if the Federal Reserve continues to hike interest rates when it meets next on June 13 and June 14, it could cause more volatility.
Want direct analysis? Find me in the BZ Pro lounge! Click here for a free trial.
More experienced traders who wish to play the SPY either bullishly or bearishly may choose to do so through one of two Direxion ETFs. Bullish traders can enter a short-term position in Direxion Daily S&P 500 Bull 3X Shares (NYSE:SPXL) and bearish traders can trade the inverse ETF, Direxion Daily S&P 500 Bear 3X Shares (NYSE:SPXS).
The ETFs: SPXL and SPXS are triple leveraged funds that track the movement of the SPY, seeking a return of 300% or –300% on the return of the benchmark index over a single day.
It should be noted that leveraged ETFs are meant to be used as a trading vehicle as opposed to long-term investments.
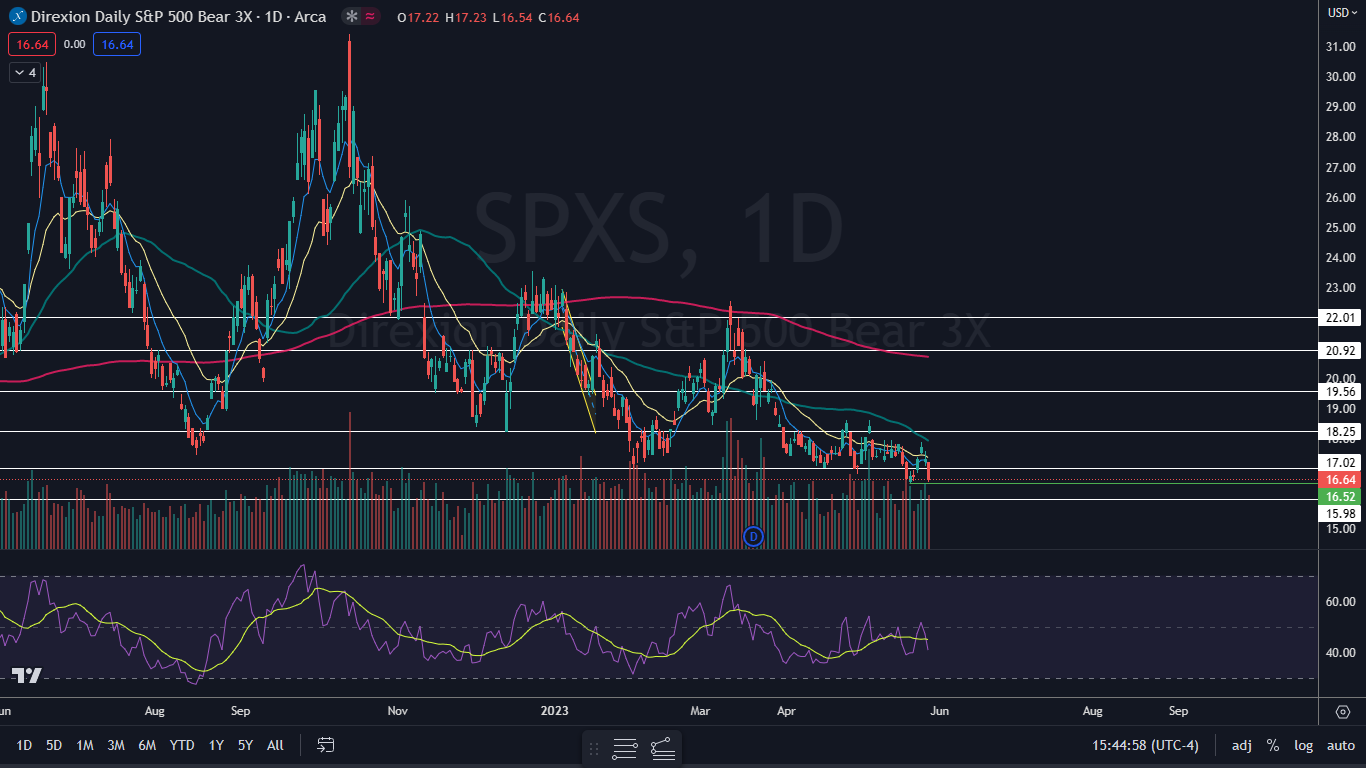
The SPXS Chart: SPXS dropped 3.82% on Friday, closing 2 cents above the May 19 low of $16.52. The ETF hasn’t traded at that level since March 30, 2022.
- Traders who are bearish on the stock market want to see SPXS bounce on Monday, which would cause a bullish double bottom pattern to form. If that happens, the double top the SPY may have formed on Friday could be in play.
- Traders who are bullish on the stock market want to see SPXS fall under $16.50, which could accelerate a move to the downside on SPXS.
- SPXS printed a bearish Marubozu candlestick on Friday, which suggests more downside is the most likely outcome. The second most likely scenario is that the ETF trades sideways on Monday, forming an inside bar pattern on the daily chart.
- SPXS has resistance above at $17.02 and $18.25 and support below at $15.98 and the psychologically important $15 mark.
 Read Next: A Look At Apple Stock Heading Into The Week
Posted In: SPXL SPXS SPY