Cannabis Chart Of The Week: Q2 EBITDAs Beat Estimates, But Full-Year Projections Tell A Different Story
Author: Viridian Capital Advisors | August 21, 2023 03:10pm
Second quarter 2023 earnings releases are complete, and the results were fascinating. One of the things that makes us skeptical about these quarterly reports is the forceful steering that companies apply to try to move estimates down.
We generally lay out the earnings schedule weeks in advance and enter the expected revenues and EBITDA for each company. When we updated actuals this quarter, we noted that analysts had markedly lowered EBITDA estimates from what they had a couple of weeks earlier! It appears that corporate IR had talked analysts down to make it easier to beat the consensus estimates. It clearly worked! Ten of the fourteen companies on the chart beat their revised estimates – as easy as shooting fish in a barrel!
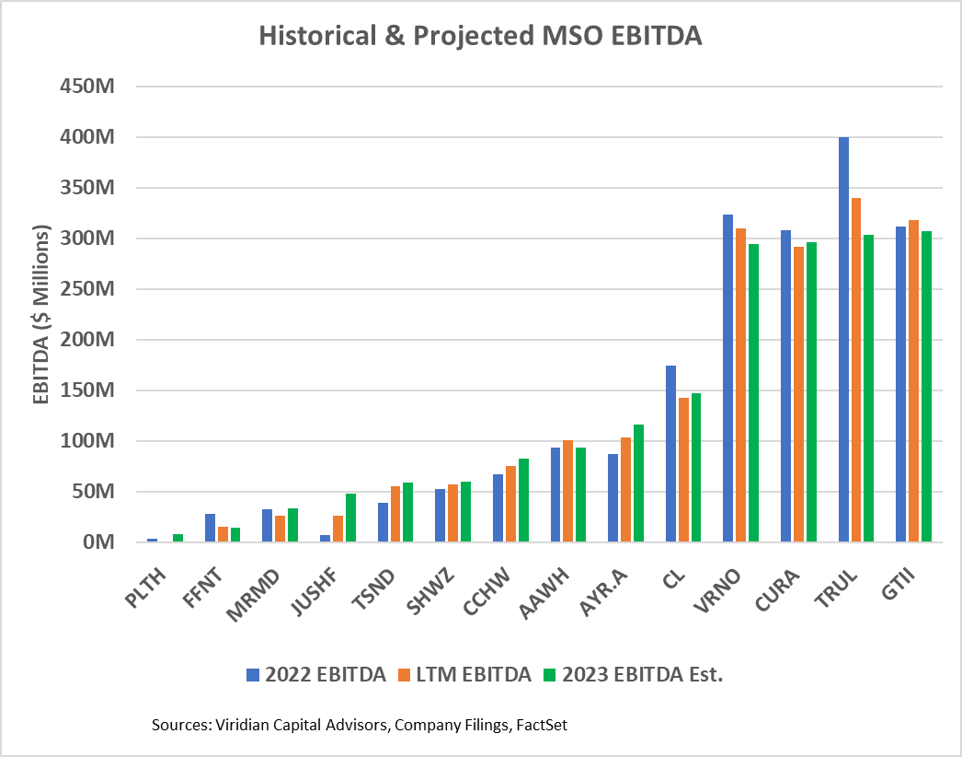
We have always found the longer-term estimates to be more interesting and predictive. The chart shows actual 2022 EBITDA, LTM EBITDA, and consensus 2023 EBITDA estimates for fourteen of the largest MSOs.
Note that six of the fourteen, including the five largest MSOs, have lower expected 2023 EBITDA than actual 2022 EBITDA. The group, in aggregate, is projected to be down 3.2% for 2023. The pattern of achieving this is also interesting. Q1: 23 EBITDA was down 5.5% from Q1: 22. Q2: 23 was down a larger 8.4% versus the year-earlier (despite those estimate beats!) But H2: 23 EBITDA is projected to increase by .4% versus H2: 22.
We are frankly skeptical about this projected turnaround. Corporate IR people have consistently pointed to the benefits of Maryland and price rationalization in Illinois as reasons for this uptick, but these simply do not seem large enough to make the difference.
Aggressive inventory management is likely to restrain the 2nd half EBITDA snapback. Companies are aggressively cutting inventory, prioritizing cash flow generation over margins. This is apparent from Q2:23 financials. The average days of inventory for q2 were 107 days, down from 115 days at the end of Q1. Six of the fourteen companies had lower inventory days. This probably was a factor in the gross margin decline for the group from 40% in Q1 to 39% in Q2. We believe these efforts are ongoing and likely to pressure gross margins in H2.
Analysts were persuaded to cut their Q2 EBITDA estimates but have left H2 23 assessments at suspect levels. We believe further reductions in 2023 EBITDA estimates are likely. Of course, a case-by-case analysis is necessary. TerrAscend (OTC:TRSSF) may be an example of where Maryland does make the difference. Similarly, AYR’s (OTC:AYRWF) growing market share in Florida may explain its higher 2023 EBITDA. Nonetheless, it is clearly a time for caution.
The Viridian Capital Chart of the Week highlights key investment, valuation and M&A trends taken from the Viridian Cannabis Deal Tracker.
The Viridian Cannabis Deal Tracker provides the market intelligence that cannabis companies, investors, and acquirers utilize to make informed decisions regarding capital allocation and M&A strategy. The Deal Tracker is a proprietary information service that monitors capital raise and M&A activity in the legal cannabis, CBD, and psychedelics industries. Each week the Tracker aggregates and analyzes all closed deals and segments each according to key metrics:
-
Deals by Industry Sector (To track the flow of capital and M&A Deals by one of 12 Sectors - from Cultivation to Brands to Software)
-
Deal Structure (Equity/Debt for Capital Raises, Cash/Stock/Earnout for M&A) Status of the company announcing the transaction (Public vs. Private)
-
Principals to the Transaction (Issuer/Investor/Lender/Acquirer) Key deal terms (Pricing and Valuation)
-
Key Deal Terms (Deal Size, Valuation, Pricing, Warrants, Cost of Capital)
-
Deals by Location of Issuer/Buyer/Seller (To Track the Flow of Capital and M&A Deals by State and Country)
-
Credit Ratings (Leverage and Liquidity Ratios)
Since its inception in 2015, the Viridian Cannabis Deal Tracker has tracked and analyzed more than 2,500 capital raises and 1,000 M&A transactions totaling over $50 billion in aggregate value.
The preceding article is from one of our external contributors. It does not represent the opinion of Benzinga and has not been edited.
Posted In: AYRWF TRSSF