Cannabis Chart Of The Week: How Much Run Is Left In MSO Valuation Multiples?
Author: Viridian Capital Advisors | September 11, 2023 02:18pm
The MSOS ETF (NYSE:MSOS) gained 69.4% between 8/25/23, five days before the blockbuster announcement of an HHS rescheduling recommendation to this past Friday, 9/8/23. Similarly, the EV/Next-Twelve-Month consensus EBITDA multiples for the group in the chart have increased by 27.5%.
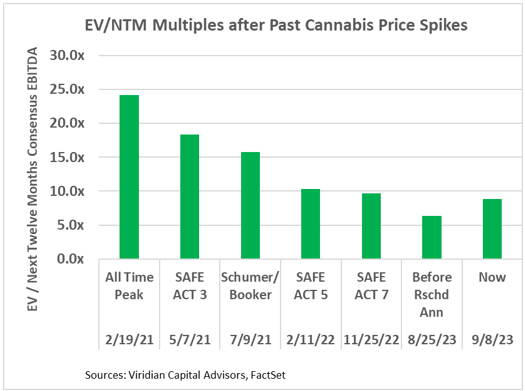
Viridian’s Chart of the Week looks at the valuation multiples of the eleven largest MSOs after previous announcements that produced upward spikes in Cannabis equity prices.
The chart depicts an aggregate multiple calculated by the sum of enterprise values divided by the sum of mean consensus EBITDA estimates for the following four quarters.
The group includes: Ascend (OTC:AAWH), AYR (OTC:AYRWF), Columbia Care (OTC:CCHWF), Cresco (OTC:CRLBF), Curaleaf (OTC:CURLF), 4Front (OTC:FFNTF), Green Thumb (OTC:GTBIF), Jushi (OTC:JUSHF), TerrAscend (OTC:TRSSF), Trulieve (OTC:TCNNF), and Verano (OTC:VRNOF).
Current valuation multiples of 8.8x for the group are now within 17.7% and 10.0% of the most recent 10.4x and 9.7x peaks in 2/11/22 and 11/25/22 after the fifth and seventh near passages of the SAFE ACT. We do not think these two peaks are fair estimates of what should be achievable in the current climate, as we never viewed the SAFE ACT as having nearly as significant cash flow implications for MSOs as the removal of 280e.
The Schumer/Booker Cannabis Administration and Opportunity Act (“CAOA”), leaked as early as July 9, 2021, was a much bigger deal, completely de-scheduling cannabis, thereby achieving removal of 280e (albeit by instituting a sliding scale of excise taxes that went from 5% to 25% depending on firm size) as well as the of the benefits of the SAFE ACT. The current rescheduling proposal and a SAFE Act would achieve all of the significant economic benefits of CAOA without somewhat heavy-handed increased federal oversight. We, therefore, view the 15.73x multiple reached post-CAOA introduction as a reasonable target for the current market, producing potential gains of 78.6% for the group.
On a cautionary note, one should recognize that the previous peaks were achieved in more favorable macroeconomic and industry-economic backgrounds. Our DCF model (updated for earlier removal of 280e) now shows an intrinsic value of 11.6x, and approximately 1.7 of that relates to higher risk-free rates, which affect discount rates. In our view, slower growth and lower margin expectations mean that achieving the past all-time peak 24.1x is improbable.
We believe there is still significantly more upside in cannabis MSO multiples. Investors who fear that they may have missed the move should reflect on historical multiples and discounted cash flow analysis, both of which will reveal significant incremental upside potential to be realized. Consensus EBITDA estimates have not yet been adjusted upward to reflect more substantial growth potential from stronger after-tax cash flows. However, this is another aspect of price appreciation not reflected in our valuation multiples analysis.
The Viridian Capital Chart of the Week highlights key investment, valuation and M&A trends taken from the Viridian Cannabis Deal Tracker.
The Viridian Cannabis Deal Tracker provides the market intelligence that cannabis companies, investors, and acquirers utilize to make informed decisions regarding capital allocation and M&A strategy. The Deal Tracker is a proprietary information service that monitors capital raise and M&A activity in the legal cannabis, CBD, and psychedelics industries. Each week the Tracker aggregates and analyzes all closed deals and segments each according to key metrics:
-
Deals by Industry Sector (To track the flow of capital and M&A Deals by one of 12 Sectors - from Cultivation to Brands to Software)
-
Deal Structure (Equity/Debt for Capital Raises, Cash/Stock/Earnout for M&A) Status of the company announcing the transaction (Public vs. Private)
-
Principals to the Transaction (Issuer/Investor/Lender/Acquirer) Key deal terms (Pricing and Valuation)
-
Key Deal Terms (Deal Size, Valuation, Pricing, Warrants, Cost of Capital)
-
Deals by Location of Issuer/Buyer/Seller (To Track the Flow of Capital and M&A Deals by State and Country)
-
Credit Ratings (Leverage and Liquidity Ratios)
Since its inception in 2015, the Viridian Cannabis Deal Tracker has tracked and analyzed more than 2,500 capital raises and 1,000 M&A transactions totaling over $50 billion in aggregate value.
The preceding article is from one of our external contributors. It does not represent the opinion of Benzinga and has not been edited.
Posted In: AAWH AYRWF CCHWF CRLBF CURLF FFNTF GTBIF JUSHF MSOS TCNNF TRSSF VRNOF