Cannabis Chart Of The Week: Most MSO Revenue Growth Is New Market Related
Author: Viridian Capital Advisors | October 23, 2023 12:34pm
The green bars depict estimated sequential quarter growth for Q3:23, while the orange bars show year-over-year growth.
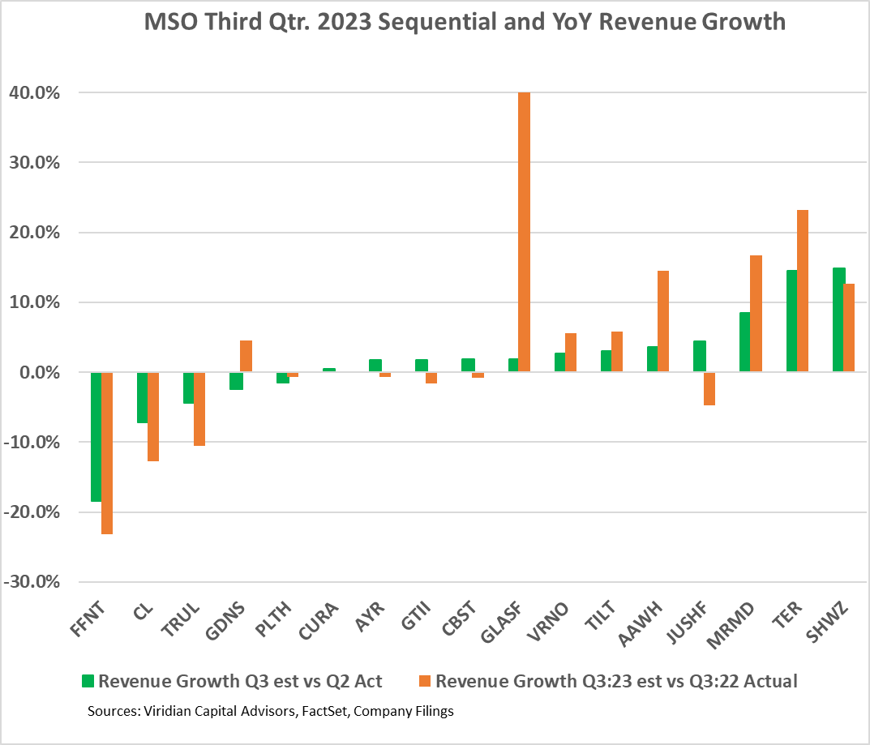
The Viridian Chart of the Week shows analyst estimates for MSO revenue for the third quarter of 2023 relative to the second quarter of 2023 and the third quarter of 2022.
The green bars depict estimated sequential quarter growth for Q3:23, while the orange bars show year-over-year growth.
Analysts expect weak Q3 revenue growth, with a few bright spots based on acquisitions and entrances of new markets, chiefly Maryland. The seventeen companies on the chart are expected to register a sequential revenue growth of only 0.6% and a year-over-year growth of 0.0%
Eleven of the seventeen companies shown have projected sequential quarterly growth either negative (5 companies) or below 3%.
4Front (OTC:FFNTF), down 18.5% sequentially, is suffering from delays in completing its Illinois cultivation facility and building out its dispensary network in the state. The company entered a $10M loan agreement this week to fund the dispensary buildout. The overall expansion has the potential to double sales.
Cresco Labs (OTC:TRSSF), down 7.2% sequentially, is heavily exposed to Pennsylvania and Illinois, two states that appear to have experienced flat to slightly down sales for the quarter.
Trulieve (OTC:TCNNF), down 4.4%, was impacted by market share loss in its core Florida market and double-digit declines in Arizona state revenues.
Seven companies had greater than 3% sequential growth including Verano (OTC:VRNOF), TILT (OTC:TLLTF), Ascend Wellness (OTC:AAWH), Jushi (OTC:JUSHF), MariMed (OTC:MRMD), TerrAscend (OTC:TRSSF), and Schwazze. Of these, TILT and Jushi rebounded off weak q2 results, while Schwazze's results primarily reflect the acquisitions that added 17 stores to the company's footprint.
Maryland is the key factor behind the outsized growth of Ascend, MariMed, and TerrAscend. Ascend and TerrAscend both have the maximum of four stores, while MariMed has one. Verano, GTI, and Curaleaf also have the maximum number of stores in Maryland; however, their size and diversification make the addition of Maryland barely perceptible.
Year-over-year revenue growth generally followed a similar pattern except for Glass House Brands (OTC:GLASF), which is up 61% yoy. Glass House has made significant gains in its greenhouse production capacity, and the company is also expected to have 55% higher revenues for the second half of 2023 compared to the 1st half.
Luckily, investors are focused on cash flows and balance sheet repair because revenue growth through the end of 2023 is expected to remain anemic, totaling less than 2%.
The Viridian Capital Chart of the Week highlights key investment, valuation and M&A trends taken from the Viridian Cannabis Deal Tracker.
The Viridian Cannabis Deal Tracker provides the market intelligence that cannabis companies, investors, and acquirers utilize to make informed decisions regarding capital allocation and M&A strategy. The Deal Tracker is a proprietary information service that monitors capital raise and M&A activity in the legal cannabis, CBD, and psychedelics industries. Each week the Tracker aggregates and analyzes all closed deals and segments each according to key metrics:
-
Deals by Industry Sector (To track the flow of capital and M&A Deals by one of 12 Sectors - from Cultivation to Brands to Software)
-
Deal Structure (Equity/Debt for Capital Raises, Cash/Stock/Earnout for M&A) Status of the company announcing the transaction (Public vs. Private)
-
Principals to the Transaction (Issuer/Investor/Lender/Acquirer) Key deal terms (Pricing and Valuation)
-
Key Deal Terms (Deal Size, Valuation, Pricing, Warrants, Cost of Capital)
-
Deals by Location of Issuer/Buyer/Seller (To Track the Flow of Capital and M&A Deals by State and Country)
-
Credit Ratings (Leverage and Liquidity Ratios)
Since its inception in 2015, the Viridian Cannabis Deal Tracker has tracked and analyzed more than 2,500 capital raises and 1,000 M&A transactions totaling over $50 billion in aggregate value.
The preceding article is from one of our external contributors. It does not represent the opinion of Benzinga and has not been edited.
Posted In: AAWH FFNTF GLASF JUSHF MRMD TCNNF TLLTF TRSSF VRNOF