Tesla Charges Higher, Regains Key Indicator As Support: This ETF Offers 150% Leverage To Play Upside, Downside
Author: Melanie Schaffer | November 13, 2023 12:59pm
Tesla, Inc (NASDAQ:TSLA) was charging almost over 4% higher Monday after reports surfaced indicating India is considering implementing tax cuts on EV imports.
The Asian country, which has the highest population of any nation on earth, aims to convince Tesla to sell its cars there and eventually build a manufacturing facility in the country.
The news sent Tesla flying up over the 200-day simple moving average, which the stock fell below on Nov. 9. The 200-day SMA is an important bellwether. Technical traders and investors consider a stock trading above the level on the daily chart to be in a bull cycle, whereas a stock trading under the 200-day SMA is considered to be in a bear cycle.
The 50-day SMA also plays an important role in technical analysis, especially when paired with the 200-day. When the 50-day SMA crosses below the 200-day SMA, a death cross occurs whereas when the 50-day SMA crosses above the 200-day, a bullish golden cross takes place.
Traders wanting to play the potential further upside in Tesla may choose to take a position in Direxion Daily Tesla Bull 1.5X Shares (NASDAQ:TSLL), which seeks to return 150% of the performance of Tesla’s stock.
Conversely, traders who are bearish on Tesla could play Direxion Daily Tesla Bear 1X Shares (NASDAQ:TSLS), which tracks Apple to the inverse.
Want direct analysis? Find me in the BZ Pro lounge! Click here for a free trial.
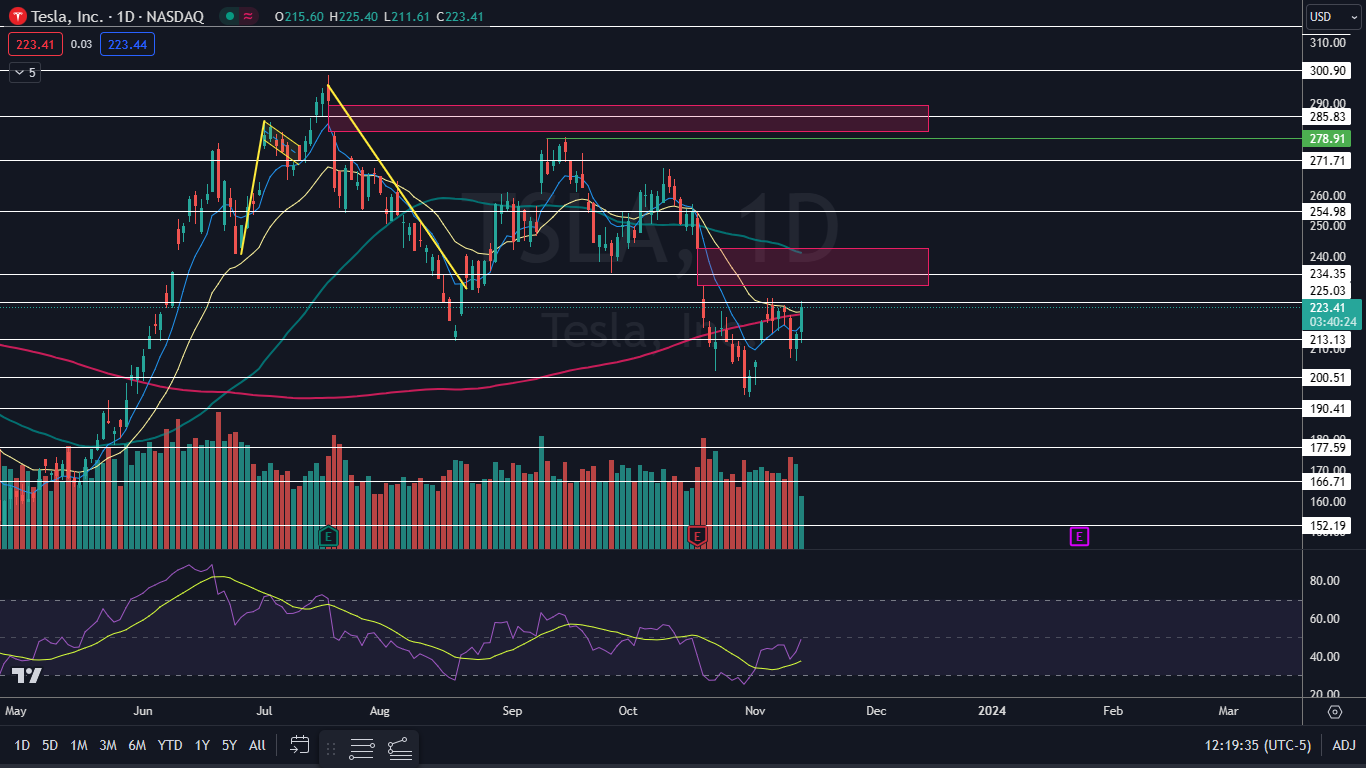
The Tesla Chart: Tesla confirmed a downtrend on Nov. 8 and Nov. 10, by printing a lower high and a lower low, respectively, but on Monday, Tesla negated that downtrend by forming a higher high. Bullish traders want to see the stock close the trading session above the 200-day SMA, which would suggest the stock has entered a new bull cycle.
- If Tesla closes the session near its high-of-day, it will form a bullish Marubozu candlestick, which could indicate higher prices will come again on Tuesday. If the stock closes the trading day with a significant upper wick, lower prices or sideways consolidation may take place, which will give bullish traders pause.
- If Tesla continues higher over the next few trading days, an upper gap that exists between $230.61 and $242.68 is likely to fill. If that happens, the stock may find at least temporary resistance at the upper range of that gap.
- If Tesla falls back under the 200-day SMA, downside pressure could accelerate, which could suggest Monday’s move higher was a bull trap.
- Tesla has resistance above at $225.03 and at $234.35 and support below at $213.13 and at $200.51.
 Read Next: Tech Giants Lead Market Surge As Dow Blue Chips Stall; Microsoft Hits New Highs While Bitcoin Rallies: The Week In The Markets
Posted In: TSLA TSLL TSLS