US Steel Shares Outperform S&P 500 - Deliver 30% Higher Returns In Single Year
Author: Surbhi Jain | December 18, 2023 09:51am
United States Steel Corp‘s (NYSE:X) stock is trading over 28% higher in premarket trading on Monday, owing to news around its acquisition by Japan-based Nippon Steel Corp (OTC:NISTF). The transaction values United States Steel at $14.9 billion.
US Steel Investors Surpass S&P 500 30%
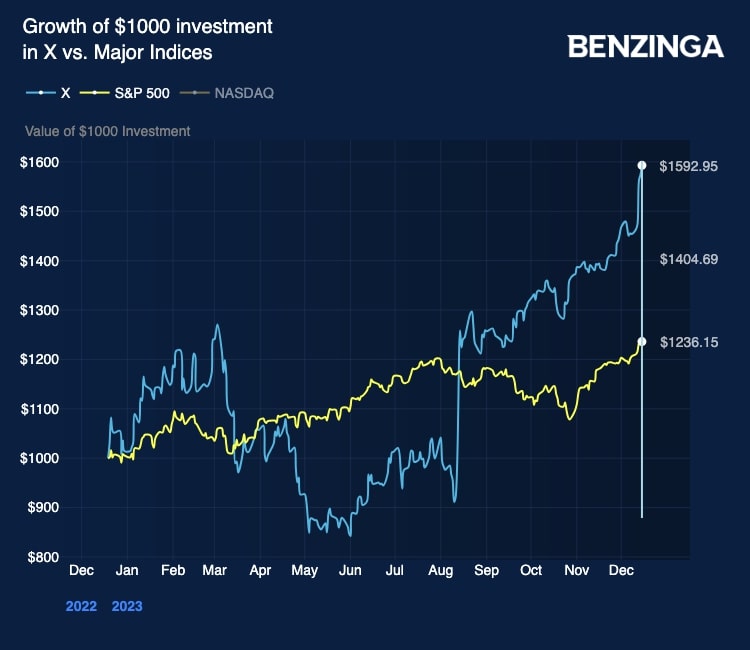
Here’s a chart depicting how a $1000 investment in U.S. Steel and the S&P 500 would have fared over the past year.
A $1000 investment in U. S. Steel stock made a year ago, would now have grown to $1,592.95. That’s a whopping 59.3% return for X stockholders. On the other hand, an equal amount invested in an S&P 500 ETF would have grown to $1,236.15.
The outperformance has been more pronounced since mid-August, when U.S. Steel launched a formal review process, after rejecting rival Cleveland-Cliffs Inc‘s (NYSE:CLF) $7.3 billion offer.
Exchange-traded funds that closely track the S&P 500 index, namely the SPDR S&P 500ETF Trust (NYSE:SPY), the iShares Core S&P 500 ETF (NYSE:IVV) and the Vanguard 500 Index Fund ETF (NYSE:VOO) are up over 23.6% over the past year.
US Steel Investors Outperform XME By 40%
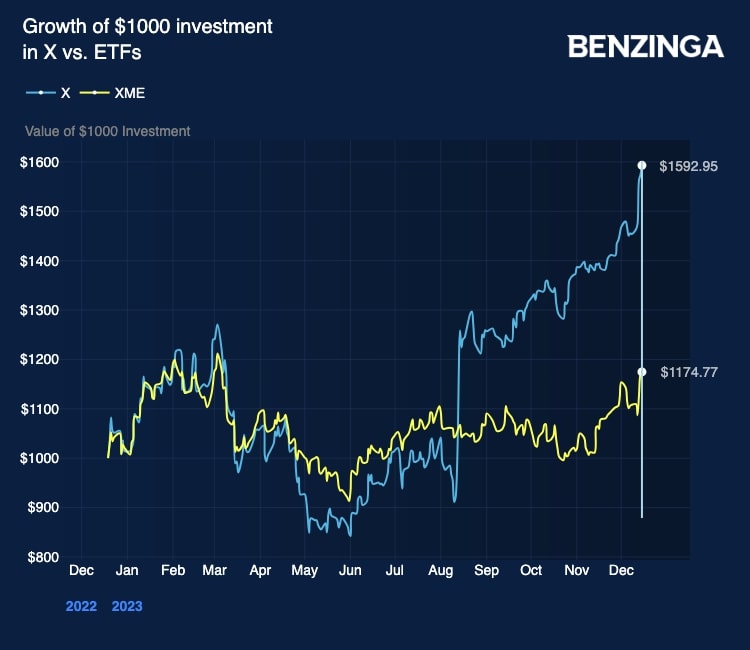
Now, let’s see how U.S. Steel’s stock has fared against the material sector benchmark – SPDR S&P Metals & Mining ETF (NYSE:XME). U.S. Steel commanded 4.81% of the XME ETF portfolio as of Dec. 14.
U.S. Steel stock has outperformed the materials sector benchmark by a good degree as well. While X stock returned 59.3% to investors, XME ETF holders only gained 17.5% over the past 1 year.
U.S. Steel is the fourth largest holding of the XME portfolio, after Alpha Metallurgical Resources Inc (NYSE:AMR), Cleveland-Cliffs and Hecla Mining Co (NYSE:HL).