Upside For Nvidia Stock Could Set This Semiconductor ETF Soaring To New Highs: A Technical Analysis Of SOXL
Author: Melanie Schaffer | March 13, 2024 02:24pm
Direxion Daily Semiconductor Bull 3X Shares (NYSE:SOXL) surged to new 25-month highs between March 1 and March 8, which Benzinga pointed out was likely to happen on Feb. 29.
After reaching the new highs, the ETF, which is a triple-leveraged fund that consists of a variety of stocks in the semiconductor sector, started to consolidate, falling about 18% from the March 8 high of $56.99.
The recent consolidation has helped drop SOXL’s relative strength index (RSI) down from about the 75% level to a more comfortable 56%. With the lowered RSI, SOXL has room to surge higher after the consolidation is over but whether or not that happens is dependent on whether the fund’s largest holdings, such as Nvidia Corporation (NASDAQ:NVDA) and Advanced Micro Devices, Inc (NASDAQ:AMD) continue to trend higher within their bull cycles.
AMD is weighted at 8.67% within the SOXL fund, while Broadcom, Inc (NASDAQ:AVGO) is weighted at 8.59%. Nvidia is the third largest holding within the ETF, weighted at 7.54%.
Read Next: AI Tailwinds Boost Super Micro Computer Analyst's Bull Case: 'Expect Strong Revenue Growth'
Trending: Elon Musk, Steve Jobs Autographed Business Cards Up For Auction: Here's How Much They Will Set You Back
On Wednesday, BofA Securities analyst Vivek Arya reiterated Buy rating on Nvidia stock and raised a price target from $925 to $1,100. The new price target implies an upside of 21% and indicates Arya sees room for Nvidia to surge higher.
There are always two sides to every trade, however, and traders who are bearish on the semiconductor sector or who are looking to trade a further pullback can track the Direxion Daily Semiconductor Bear 3X Shares (NYSE:SOXS).
It should be noted that Direxion’s leveraged funds are designed for short-term traders and shouldn’t be held for a long period of time.
Want direct analysis? Find me in the BZ Pro lounge! Click here for a free trial.
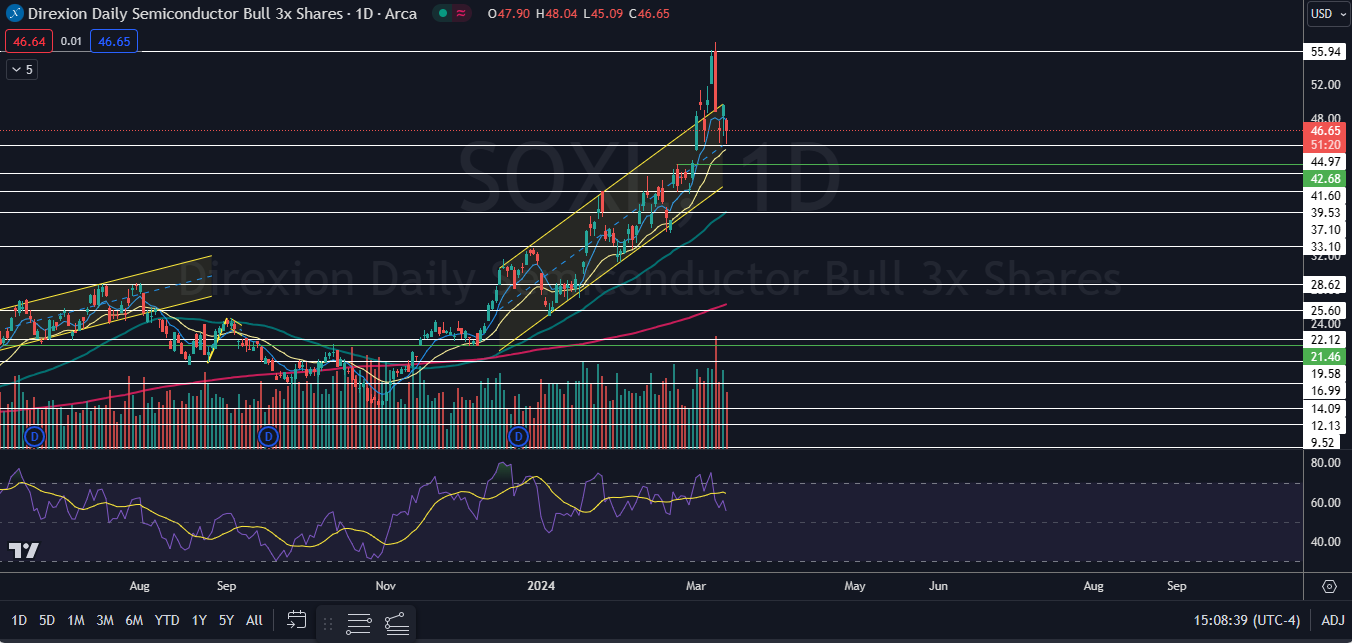
The SOXL Chart: When SOXL fell lower on Monday and Wednesday, the ETF bounced up from near the $45 mark, which SOXL also did on March 5. The bounce up from that area on three separate occasions indicates that there’s strong support at that level, which has also caused the ETF to print a triple bottom pattern there.
- On Wednesday, SOXL was working to form a hammer candlestick on the daily chart, which indicates the local bottom may have occurred. If SOXL trades higher on Thursday, Wednesday’s candlestick will be confirmed and the ETF may rise over Tuesday’s high-of-day, negating its recent downtrend.
- If SOXL breaks up above Tuesday’s high-of-day, the ETF will also break bullishly from a rising channel pattern, which SOXL has been trading in since Dec. 14.
- Bearish traders want to see SOXL fall under the $45 mark, which will negate the triple bottom pattern and could accelerate downside pressure.
- SOXL has resistance above at $50 and at $55.94 and support below at $44.97 and at $41.60.
Featured image sourced from Shutterstock
Posted In: AMD AVGO NVDA SOXL SOXS