B. Riley Financial Unusual Options Activity
Author: Benzinga Insights | April 24, 2024 10:01am
Whales with a lot of money to spend have taken a noticeably bearish stance on B. Riley Financial.
Looking at options history for B. Riley Financial (NASDAQ:RILY) we detected 18 trades.
If we consider the specifics of each trade, it is accurate to state that 22% of the investors opened trades with bullish expectations and 66% with bearish.
From the overall spotted trades, 9 are puts, for a total amount of $718,982 and 9, calls, for a total amount of $577,947.
Predicted Price Range
Based on the trading activity, it appears that the significant investors are aiming for a price territory stretching from $19.0 to $35.0 for B. Riley Financial over the recent three months.
Volume & Open Interest Trends
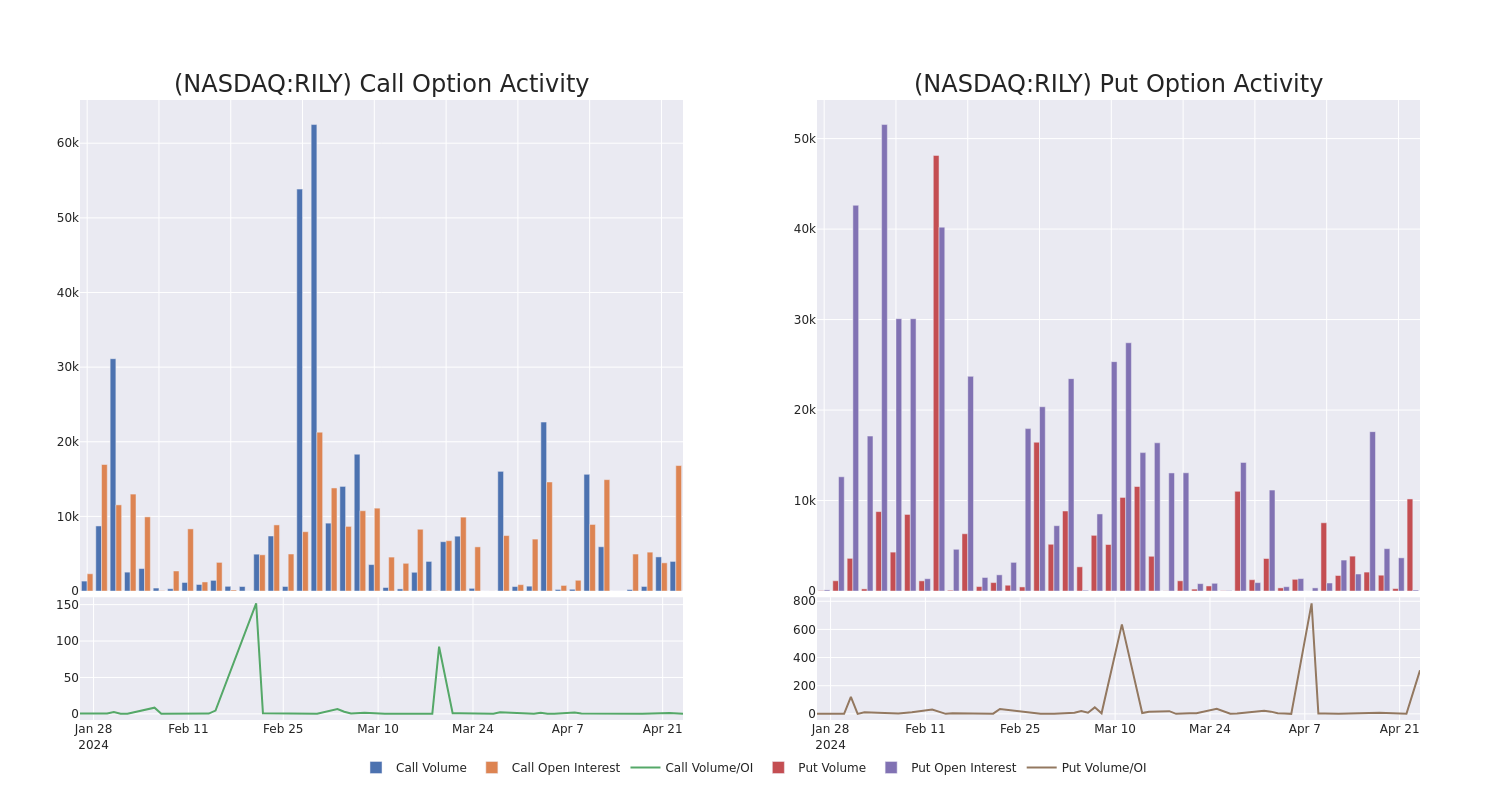
Looking at the volume and open interest is a powerful move while trading options. This data can help you track the liquidity and interest for B. Riley Financial's options for a given strike price. Below, we can observe the evolution of the volume and open interest of calls and puts, respectively, for all of B. Riley Financial's whale trades within a strike price range from $19.0 to $35.0 in the last 30 days.
B. Riley Financial 30-Day Option Volume & Interest Snapshot
Largest Options Trades Observed:
| Symbol |
PUT/CALL |
Trade Type |
Sentiment |
Exp. Date |
Ask |
Bid |
Price |
Strike Price |
Total Trade Price |
Open Interest |
Volume |
| RILY |
PUT |
TRADE |
BEARISH |
05/03/24 |
$3.5 |
$3.4 |
$3.5 |
$30.00 |
$245.0K |
5 |
753 |
| RILY |
CALL |
SWEEP |
BEARISH |
05/03/24 |
$1.35 |
$1.1 |
$1.2 |
$35.00 |
$192.3K |
3.9K |
1.3K |
| RILY |
PUT |
SWEEP |
NEUTRAL |
05/17/24 |
$4.2 |
$3.1 |
$4.08 |
$30.00 |
$81.8K |
61 |
819 |
| RILY |
PUT |
SWEEP |
BULLISH |
01/17/25 |
$13.5 |
$12.0 |
$12.0 |
$35.00 |
$78.0K |
41 |
1 |
| RILY |
PUT |
SWEEP |
BEARISH |
05/17/24 |
$3.9 |
$3.7 |
$3.87 |
$30.00 |
$66.1K |
61 |
1.4K |
About B. Riley Financial
B. Riley Financial Inc is a diversified financial services company. The company through its subsidiaries offers investment banking and financial services to corporate, institutional and high net worth clients and also asset disposition, valuation and appraisal and capital advisory services to retail, wholesale, institutional, lenders, capital providers, private equity investors, and professional services firms in United States, Canada, and Europe. It also provides internet access and subscription services. The reportable operating segments of the company include Capital Markets, Wealth Management, Financial Consulting, Auction and Liquidation, Communications, and Consumer segment.
After a thorough review of the options trading surrounding B. Riley Financial, we move to examine the company in more detail. This includes an assessment of its current market status and performance.
B. Riley Financial's Current Market Status
- Currently trading with a volume of 6,170,005, the RILY's price is up by 40.98%, now at $30.62.
- RSI readings suggest the stock is currently may be overbought.
- Anticipated earnings release is in 12 days.
Options trading presents higher risks and potential rewards. Astute traders manage these risks by continually educating themselves, adapting their strategies, monitoring multiple indicators, and keeping a close eye on market movements. Stay informed about the latest B. Riley Financial options trades with real-time alerts from Benzinga Pro.
Posted In: RILY