In-Depth Analysis: Tesla Versus Competitors In Automobiles Industry
Author: Benzinga Insights | April 29, 2024 11:00am
In the ever-changing and fiercely competitive business landscape, conducting thorough company analysis is crucial for investors and industry experts. In this article, we will undertake a comprehensive industry comparison, evaluating Tesla (NASDAQ:TSLA) and its primary competitors in the Automobiles industry. By closely examining key financial metrics, market position, and growth prospects, our aim is to provide valuable insights for investors and shed light on company's performance within the industry.
Tesla Background
Founded in 2003 and based in Palo Alto, California, Tesla is a vertically integrated sustainable energy company that also aims to transition the world to electric mobility by making electric vehicles. The company sells solar panels and solar roofs for energy generation plus batteries for stationary storage for residential and commercial properties including utilities. Tesla has multiple vehicles in its fleet, which include luxury and midsize sedans and crossover SUVs. The company also plans to begin selling more affordable sedans and small SUVs, a light truck, a semi truck, and a sports car. Global deliveries in 2023 were a little over 1.8 million vehicles.
| Company |
P/E |
P/B |
P/S |
ROE |
EBITDA (in billions) |
Gross Profit (in billions) |
Revenue Growth |
| Tesla Inc |
43.04 |
8.34 |
6.20 |
1.84% |
$2.88 |
$3.7 |
-8.69% |
| Toyota Motor Corp |
10.59 |
1.46 |
1.09 |
4.21% |
$2385.42 |
$2685.29 |
23.44% |
| Honda Motor Co Ltd |
9.19 |
0.70 |
0.45 |
2.07% |
$626.97 |
$1174.13 |
21.45% |
| General Motors Co |
5.60 |
0.78 |
0.34 |
4.54% |
$6.73 |
$5.91 |
7.58% |
| Ford Motor Co |
13.19 |
1.19 |
0.29 |
3.11% |
$3.41 |
$3.6 |
3.14% |
| Li Auto Inc |
16.33 |
2.99 |
1.55 |
9.95% |
$4.19 |
$9.79 |
136.44% |
| Thor Industries Inc |
19.92 |
1.36 |
0.52 |
0.18% |
$0.1 |
$0.27 |
-5.93% |
| Winnebago Industries Inc |
18.44 |
1.39 |
0.65 |
-0.95% |
$0.01 |
$0.11 |
-18.82% |
| Average |
13.32 |
1.41 |
0.7 |
3.3% |
$432.4 |
$554.16 |
23.9% |
Through a detailed examination of Tesla, we can deduce the following trends:
-
The Price to Earnings ratio of 43.04 for this company is 3.23x above the industry average, indicating a premium valuation associated with the stock.
-
With a Price to Book ratio of 8.34, which is 5.91x the industry average, Tesla might be considered overvalued in terms of its book value, as it is trading at a higher multiple compared to its industry peers.
-
With a relatively high Price to Sales ratio of 6.2, which is 8.86x the industry average, the stock might be considered overvalued based on sales performance.
-
With a Return on Equity (ROE) of 1.84% that is 1.46% below the industry average, it appears that the company exhibits potential inefficiency in utilizing equity to generate profits.
-
With lower Earnings Before Interest, Taxes, Depreciation, and Amortization (EBITDA) of $2.88 Billion, which is 0.01x below the industry average, the company may face lower profitability or financial challenges.
-
Compared to its industry, the company has lower gross profit of $3.7 Billion, which indicates 0.01x below the industry average, potentially indicating lower revenue after accounting for production costs.
-
With a revenue growth of -8.69%, which is much lower than the industry average of 23.9%, the company is experiencing a notable slowdown in sales expansion.
Debt To Equity Ratio
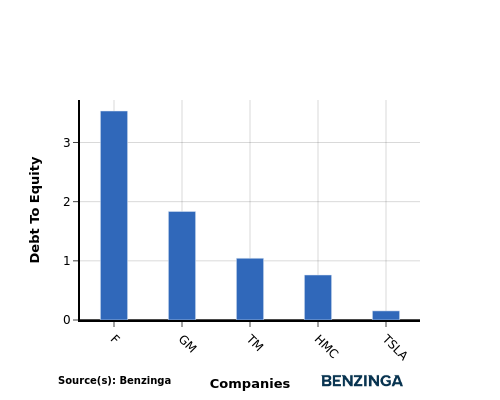
The debt-to-equity (D/E) ratio provides insights into the proportion of debt a company has in relation to its equity and asset value.
Considering the debt-to-equity ratio in industry comparisons allows for a concise evaluation of a company's financial health and risk profile, aiding in informed decision-making.
In terms of the Debt-to-Equity ratio, Tesla stands in comparison with its top 4 peers, leading to the following comparisons:
-
Compared to its top 4 peers, Tesla has a stronger financial position indicated by its lower debt-to-equity ratio of 0.15.
-
This suggests that the company relies less on debt financing and has a more favorable balance between debt and equity, which can be seen as a positive attribute by investors.
Key Takeaways
For Tesla, the PE, PB, and PS ratios are all high compared to its peers in the Automobiles industry, indicating that the stock may be overvalued. The low ROE suggests that Tesla is not generating significant returns on shareholder equity. Additionally, the low EBITDA, gross profit, and revenue growth further highlight potential weaknesses in Tesla's financial performance compared to industry competitors.
This article was generated by Benzinga's automated content engine and reviewed by an editor.
Posted In: TSLA


