Industry Comparison: Evaluating Apple Against Competitors In Technology Hardware, Storage & Peripherals Industry
Author: Benzinga Insights | May 07, 2024 11:00am
In the ever-evolving and intensely competitive business landscape, conducting a thorough company analysis is of utmost importance for investors and industry followers. In this article, we will carry out an in-depth industry comparison, assessing Apple (NASDAQ:AAPL) alongside its primary competitors in the Technology Hardware, Storage & Peripherals industry. By meticulously examining key financial metrics, market positioning, and growth prospects, we aim to offer valuable insights to investors and shed light on company's performance within the industry.
Apple Background
Apple is among the largest companies in the world, with a broad portfolio of hardware and software products targeted at consumers and businesses. Apple's iPhone makes up a majority of the firm sales, and Apple's other products like Mac, iPad, and Watch are designed around the iPhone as the focal point of an expansive software ecosystem. Apple has progressively worked to add new applications, like streaming video, subscription bundles, and augmented reality. The firm designs its own software and semiconductors while working with subcontractors like Foxconn and TSMC to build its products and chips. Slightly less than half of Apple's sales come directly through its flagship stores, with a majority of sales coming indirectly through partnerships and distribution.
| Company |
P/E |
P/B |
P/S |
ROE |
EBITDA (in billions) |
Gross Profit (in billions) |
Revenue Growth |
| Apple Inc |
28.26 |
37.55 |
7.44 |
31.88% |
$30.74 |
$42.27 |
-4.31% |
| Super Micro Computer Inc |
46.27 |
9.55 |
4.10 |
9.85% |
$0.39 |
$0.6 |
5.05% |
| Hewlett Packard Enterprise Co |
11.83 |
1.04 |
0.80 |
1.82% |
$1.23 |
$2.46 |
-13.5% |
| NetApp Inc |
24.59 |
22.41 |
3.74 |
35.49% |
$0.46 |
$1.15 |
5.24% |
| Pure Storage Inc |
283.95 |
13.81 |
6.34 |
5.41% |
$0.11 |
$0.57 |
-2.52% |
| Corsair Gaming Inc |
388.83 |
1.81 |
0.85 |
0.94% |
$0.03 |
$0.1 |
4.65% |
| Eastman Kodak Co |
7.09 |
0.41 |
0.38 |
0.21% |
$0.03 |
$0.05 |
-9.84% |
| AstroNova Inc |
27.98 |
1.51 |
0.89 |
3.06% |
$0.01 |
$0.01 |
-0.65% |
| Transact Technologies Inc |
10.96 |
1.31 |
0.71 |
-0.16% |
$0.0 |
$0.01 |
-26.13% |
| Average |
100.19 |
6.48 |
2.23 |
7.08% |
$0.28 |
$0.62 |
-4.71% |
By carefully studying Apple, we can deduce the following trends:
-
With a Price to Earnings ratio of 28.26, which is 0.28x less than the industry average, the stock shows potential for growth at a reasonable price, making it an interesting consideration for market participants.
-
It could be trading at a premium in relation to its book value, as indicated by its Price to Book ratio of 37.55 which exceeds the industry average by 5.79x.
-
The Price to Sales ratio of 7.44, which is 3.34x the industry average, suggests the stock could potentially be overvalued in relation to its sales performance compared to its peers.
-
The company has a higher Return on Equity (ROE) of 31.88%, which is 24.8% above the industry average. This suggests efficient use of equity to generate profits and demonstrates profitability and growth potential.
-
Compared to its industry, the company has higher Earnings Before Interest, Taxes, Depreciation, and Amortization (EBITDA) of $30.74 Billion, which is 109.79x above the industry average, indicating stronger profitability and robust cash flow generation.
-
The gross profit of $42.27 Billion is 68.18x above that of its industry, highlighting stronger profitability and higher earnings from its core operations.
-
The company's revenue growth of -4.31% is notably higher compared to the industry average of -4.71%, showcasing exceptional sales performance and strong demand for its products or services.
Debt To Equity Ratio
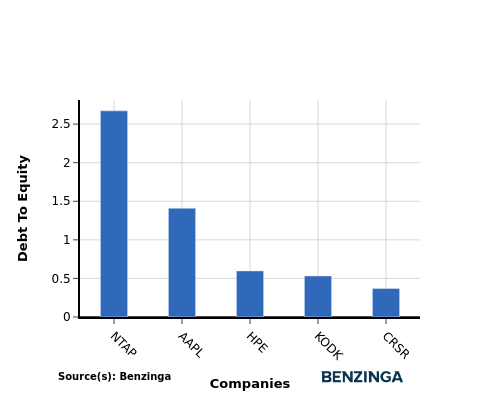
The debt-to-equity (D/E) ratio helps evaluate the capital structure and financial leverage of a company.
Considering the debt-to-equity ratio in industry comparisons allows for a concise evaluation of a company's financial health and risk profile, aiding in informed decision-making.
When evaluating Apple alongside its top 4 peers in terms of the Debt-to-Equity ratio, the following insights arise:
-
Apple holds a middle position in terms of the debt-to-equity ratio compared to its top 4 peers.
-
This indicates a balanced financial structure with a moderate level of debt and an appropriate reliance on equity financing with a debt-to-equity ratio of 1.41.
Key Takeaways
The PE, PB, and PS ratios for Apple indicate that it may be undervalued compared to its peers in the Technology Hardware, Storage & Peripherals industry. Apple's high ROE, EBITDA, gross profit, and revenue growth suggest strong financial performance relative to industry competitors. Overall, Apple appears to be a promising investment opportunity based on these key valuation metrics.
This article was generated by Benzinga's automated content engine and reviewed by an editor.
Posted In: AAPL


