Investigating NVIDIA's Standing In Semiconductors & Semiconductor Equipment Industry Compared To Competitors
Author: Benzinga Insights | May 10, 2024 11:00am
Amidst the fast-paced and highly competitive business environment of today, conducting comprehensive company analysis is essential for investors and industry enthusiasts. In this article, we will delve into an extensive industry comparison, evaluating NVIDIA (NASDAQ:NVDA) in comparison to its major competitors within the Semiconductors & Semiconductor Equipment industry. By analyzing critical financial metrics, market position, and growth potential, our objective is to provide valuable insights for investors and offer a deeper understanding of company's performance in the industry.
NVIDIA Background
Nvidia is a leading developer of graphics processing units. Traditionally, GPUs were used to enhance the experience on computing platforms, most notably in gaming applications on PCs. GPU use cases have since emerged as important semiconductors used in artificial intelligence. Nvidia not only offers AI GPUs, but also a software platform, Cuda, used for AI model development and training. Nvidia is also expanding its data center networking solutions, helping to tie GPUs together to handle complex workloads.
| Company |
P/E |
P/B |
P/S |
ROE |
EBITDA (in billions) |
Gross Profit (in billions) |
Revenue Growth |
| NVIDIA Corp |
74.39 |
51.62 |
36.33 |
32.23% |
$14.56 |
$16.79 |
265.28% |
| Broadcom Inc |
48.52 |
8.61 |
14.66 |
2.81% |
$4.61 |
$7.38 |
34.17% |
| Advanced Micro Devices Inc |
220.86 |
4.38 |
10.91 |
0.22% |
$0.9 |
$2.56 |
-11.27% |
| Qualcomm Inc |
24.07 |
8.23 |
5.59 |
9.79% |
$3.08 |
$5.28 |
1.23% |
| Texas Instruments Inc |
28.87 |
9.94 |
10.11 |
6.52% |
$1.77 |
$2.1 |
-16.4% |
| Intel Corp |
31.02 |
1.21 |
2.31 |
-0.36% |
$1.83 |
$5.22 |
-17.41% |
| ARM Holdings PLC |
355.59 |
20.26 |
33.32 |
4.35% |
$0.06 |
$0.89 |
12.62% |
| Analog Devices Inc |
36.57 |
2.86 |
8.90 |
1.3% |
$1.12 |
$1.47 |
-22.68% |
| Microchip Technology Inc |
26.29 |
7.43 |
6.57 |
2.25% |
$0.39 |
$0.79 |
-24.91% |
| STMicroelectronics NV |
10.34 |
2.13 |
2.30 |
3.04% |
$1.06 |
$1.44 |
-18.41% |
| Monolithic Power Systems Inc |
84.39 |
16.30 |
18.92 |
4.45% |
$0.1 |
$0.25 |
1.51% |
| ON Semiconductor Corp |
14.55 |
3.78 |
3.88 |
5.7% |
$0.71 |
$0.85 |
-4.95% |
| GLOBALFOUNDRIES Inc |
32.05 |
2.55 |
4.05 |
1.19% |
$0.54 |
$0.39 |
-15.86% |
| ASE Technology Holding Co Ltd |
20.72 |
2.47 |
1.24 |
1.94% |
$23.55 |
$20.87 |
1.46% |
| First Solar Inc |
20.29 |
3 |
5.84 |
5.38% |
$0.36 |
$0.35 |
15.58% |
| United Microelectronics Corp |
10.67 |
1.88 |
2.86 |
3.43% |
$23.32 |
$17.81 |
-18.98% |
| Skyworks Solutions Inc |
17.37 |
2.33 |
3.27 |
2.91% |
$0.31 |
$0.42 |
-9.29% |
| Lattice Semiconductor Corp |
44.92 |
14.12 |
14.09 |
2.15% |
$0.03 |
$0.1 |
-23.6% |
| Universal Display Corp |
37.75 |
5.55 |
13.53 |
3.86% |
$0.07 |
$0.13 |
26.67% |
| MACOM Technology Solutions Holdings Inc |
114.03 |
7 |
11.50 |
1.45% |
$0.04 |
$0.1 |
6.98% |
| Rambus Inc |
17.05 |
6.08 |
13.30 |
3.24% |
$0.05 |
$0.09 |
3.61% |
| Average |
59.8 |
6.51 |
9.36 |
3.28% |
$3.19 |
$3.42 |
-4.0% |
By closely studying NVIDIA, we can observe the following trends:
-
Notably, the current Price to Earnings ratio for this stock, 74.39, is 1.24x above the industry norm, reflecting a higher valuation relative to the industry.
-
It could be trading at a premium in relation to its book value, as indicated by its Price to Book ratio of 51.62 which exceeds the industry average by 7.93x.
-
The Price to Sales ratio of 36.33, which is 3.88x the industry average, suggests the stock could potentially be overvalued in relation to its sales performance compared to its peers.
-
The Return on Equity (ROE) of 32.23% is 28.95% above the industry average, highlighting efficient use of equity to generate profits.
-
The Earnings Before Interest, Taxes, Depreciation, and Amortization (EBITDA) of $14.56 Billion is 4.56x above the industry average, highlighting stronger profitability and robust cash flow generation.
-
The gross profit of $16.79 Billion is 4.91x above that of its industry, highlighting stronger profitability and higher earnings from its core operations.
-
With a revenue growth of 265.28%, which surpasses the industry average of -4.0%, the company is demonstrating robust sales expansion and gaining market share.
Debt To Equity Ratio
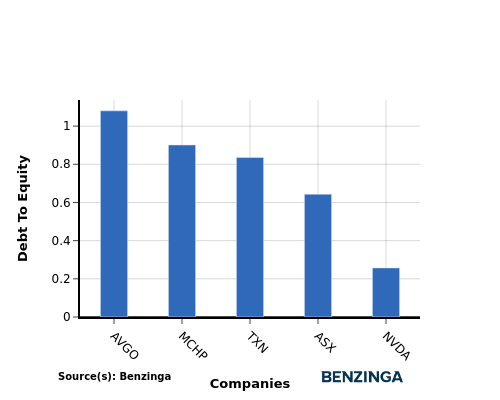
The debt-to-equity (D/E) ratio gauges the extent to which a company has financed its operations through debt relative to equity.
Considering the debt-to-equity ratio in industry comparisons allows for a concise evaluation of a company's financial health and risk profile, aiding in informed decision-making.
In light of the Debt-to-Equity ratio, a comparison between NVIDIA and its top 4 peers reveals the following information:
-
Compared to its top 4 peers, NVIDIA has a stronger financial position indicated by its lower debt-to-equity ratio of 0.26.
-
This suggests that the company relies less on debt financing and has a more favorable balance between debt and equity, which can be seen as a positive attribute by investors.
Key Takeaways
For NVIDIA, the PE, PB, and PS ratios are all high compared to its industry peers in the Semiconductors & Semiconductor Equipment sector, indicating potential overvaluation. On the other hand, the high ROE, EBITDA, gross profit, and revenue growth suggest strong financial performance and growth prospects relative to its competitors. Overall, NVIDIA's valuation metrics point to a premium in terms of traditional valuation ratios, but its operational performance metrics show strength and potential for future growth in the industry.
This article was generated by Benzinga's automated content engine and reviewed by an editor.
Posted In: NVDA


