What Analysts Are Saying About Dutch Bros Stock
Author: Benzinga Insights | May 16, 2024 10:00am
Throughout the last three months, 17 analysts have evaluated Dutch Bros (NYSE:BROS), offering a diverse set of opinions from bullish to bearish.
The following table summarizes their recent ratings, shedding light on the changing sentiments within the past 30 days and comparing them to the preceding months.
|
Bullish |
Somewhat Bullish |
Indifferent |
Somewhat Bearish |
Bearish |
| Total Ratings |
2 |
7 |
8 |
0 |
0 |
| Last 30D |
0 |
1 |
0 |
0 |
0 |
| 1M Ago |
1 |
1 |
2 |
0 |
0 |
| 2M Ago |
1 |
3 |
4 |
0 |
0 |
| 3M Ago |
0 |
2 |
2 |
0 |
0 |
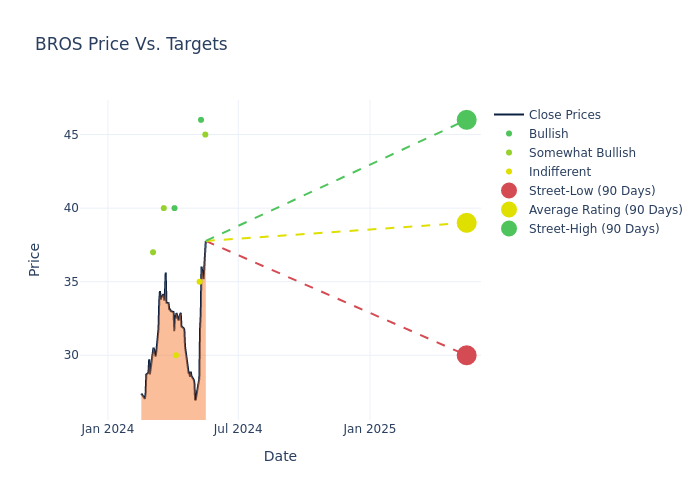
Analysts' evaluations of 12-month price targets offer additional insights, showcasing an average target of $36.35, with a high estimate of $46.00 and a low estimate of $30.00. Surpassing the previous average price target of $34.50, the current average has increased by 5.36%.
Breaking Down Analyst Ratings: A Detailed Examination
The analysis of recent analyst actions sheds light on the perception of Dutch Bros by financial experts. The following summary presents key analysts, their recent evaluations, and adjustments to ratings and price targets.
| Analyst |
Analyst Firm |
Action Taken |
Rating |
Current Price Target |
Prior Price Target |
| Nick Setyan |
Wedbush |
Raises |
Outperform |
$45.00 |
$39.00 |
| Andrew Charles |
TD Cowen |
Raises |
Buy |
$46.00 |
$33.00 |
| Jeffrey Bernstein |
Barclays |
Raises |
Equal-Weight |
$35.00 |
$30.00 |
| Nick Setyan |
Wedbush |
Raises |
Outperform |
$39.00 |
$37.00 |
| Andrew Charles |
TD Cowen |
Maintains |
Hold |
$33.00 |
- |
| Andrew Charles |
TD Cowen |
Maintains |
Hold |
$33.00 |
- |
| Andrew Charles |
TD Cowen |
Maintains |
Hold |
$33.00 |
- |
| Nick Setyan |
Wedbush |
Maintains |
Outperform |
$37.00 |
- |
| Andrew Charles |
TD Cowen |
Maintains |
Hold |
$33.00 |
- |
| Gregory Francfort |
Guggenheim |
Maintains |
Neutral |
$30.00 |
- |
| Chris O'Cull |
Stifel |
Maintains |
Buy |
$40.00 |
$40.00 |
| Nick Setyan |
Wedbush |
Maintains |
Outperform |
$37.00 |
- |
| John Ivankoe |
JP Morgan |
Raises |
Overweight |
$40.00 |
$34.00 |
| Brian Mullan |
Piper Sandler |
Raises |
Overweight |
$37.00 |
$32.00 |
| Jeffrey Bernstein |
Barclays |
Lowers |
Equal-Weight |
$30.00 |
$31.00 |
| Andrew Charles |
TD Cowen |
Maintains |
Market Perform |
$33.00 |
- |
| Nick Setyan |
Wedbush |
Maintains |
Outperform |
$37.00 |
- |
Key Insights:
- Action Taken: Analysts adapt their recommendations to changing market conditions and company performance. Whether they 'Maintain', 'Raise' or 'Lower' their stance, it reflects their response to recent developments related to Dutch Bros. This information provides a snapshot of how analysts perceive the current state of the company.
- Rating: Analysts assign qualitative assessments to stocks, ranging from 'Outperform' to 'Underperform'. These ratings convey the analysts' expectations for the relative performance of Dutch Bros compared to the broader market.
- Price Targets: Analysts navigate through adjustments in price targets, providing estimates for Dutch Bros's future value. Comparing current and prior targets offers insights into analysts' evolving expectations.
For valuable insights into Dutch Bros's market performance, consider these analyst evaluations alongside crucial financial indicators. Stay well-informed and make prudent decisions using our Ratings Table.
Stay up to date on Dutch Bros analyst ratings.
All You Need to Know About Dutch Bros
Dutch Bros Inc is an operator and franchisor of drive-thru coffee shops that are focused on serving hand-crafted beverages. The company's hand-crafted beverage-focused lineup features hot and cold espresso-based beverages, cold brew coffee products, proprietary energy drinks, tea, lemonade, smoothies and other beverages. The company has two reportable operating segments company-operated shops and franchising and other.
Dutch Bros: Financial Performance Dissected
Market Capitalization Analysis: Below industry benchmarks, the company's market capitalization reflects a smaller scale relative to peers. This could be attributed to factors such as growth expectations or operational capacity.
Revenue Growth: Dutch Bros's revenue growth over a period of 3 months has been noteworthy. As of 31 March, 2024, the company achieved a revenue growth rate of approximately 39.46%. This indicates a substantial increase in the company's top-line earnings. As compared to its peers, the company achieved a growth rate higher than the average among peers in Consumer Discretionary sector.
Net Margin: Dutch Bros's net margin surpasses industry standards, highlighting the company's exceptional financial performance. With an impressive 2.57% net margin, the company effectively manages costs and achieves strong profitability.
Return on Equity (ROE): Dutch Bros's ROE falls below industry averages, indicating challenges in efficiently using equity capital. With an ROE of 1.81%, the company may face hurdles in generating optimal returns for shareholders.
Return on Assets (ROA): Dutch Bros's ROA is below industry averages, indicating potential challenges in efficiently utilizing assets. With an ROA of 0.37%, the company may face hurdles in achieving optimal financial returns.
Debt Management: With a below-average debt-to-equity ratio of 2.07, Dutch Bros adopts a prudent financial strategy, indicating a balanced approach to debt management.
The Core of Analyst Ratings: What Every Investor Should Know
Analyst ratings serve as essential indicators of stock performance, provided by experts in banking and financial systems. These specialists diligently analyze company financial statements, participate in conference calls, and engage with insiders to generate quarterly ratings for individual stocks.
Some analysts also offer predictions for helpful metrics such as earnings, revenue, and growth estimates to provide further guidance as to what to do with certain tickers. It is important to keep in mind that while stock and sector analysts are specialists, they are also human and can only forecast their beliefs to traders.
This article was generated by Benzinga's automated content engine and reviewed by an editor.
Posted In: BROS