Stitch Fix Inc (NASDAQ:SFIX) will be reporting its third-quarter earnings on Tuesday. Wall Street expects -23 cents in EPS and $306.12 million in revenues as the company reports after market hours.
The stock is down 24.89% over the past year, and has dropped 27.73% YTD. Stitch Fix is a personalized clothing company that combines expert stylists with data science to provide online personal styling services to clients across the US.
Stitch Fix has been able to maintain steady growth in a competitive apparel industry market. Despite some fluctuations in stock prices, investors in the apparel sector have shown confidence in Stitch Fix, with Charles Schwab Investment Management Inc. increasing its stake in the company.
Telsey Advisory Group also maintains a positive outlook on Stitch Fix, with an optimistic price target indicating potential growth in the future. The company has a $4 price target for SFIX stock, indicating a potential upside of 76.21%.
Let’s look at what the charts indicate for Stitch Fix stock and how the stock currently maps against Wall Street estimates.
Stitch Fix Stock Chart Bullish Ahead Of Q3 Earnings
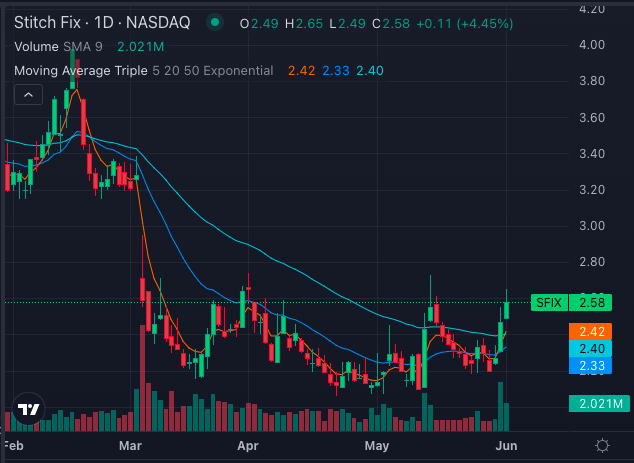
Charts indicate that the current trend for Stitch Fix stock is strongly bullish as the share price is above its 5, 20, and 50 day exponential moving averages.
Additionally, the 8-day simple moving average is indicating a bullish signal. The stock price is also above the 20-day and 50-day simple moving averages, further supporting the bullish sentiment. However, the stock price is below the 200-day simple moving average, signaling longer-term bearishness.
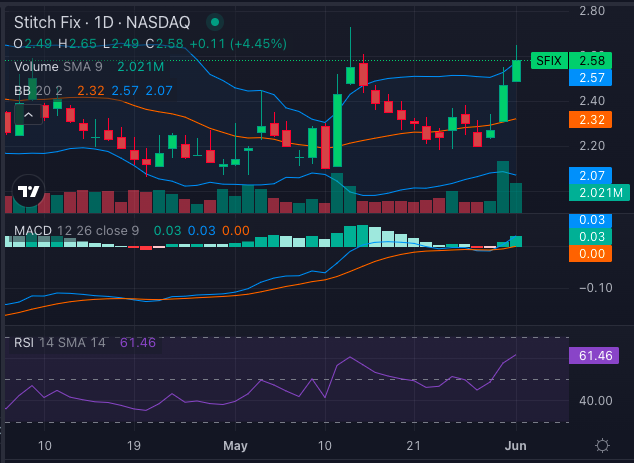
The Moving Average Convergence Divergence (MACD) indicator is positive at 0.03, suggesting a bullish signal as well. The Relative Strength Index (RSI), however, is at 61 and treading upwards towards overbought levels at 70.
The Bollinger Bands have the stock trading within them and in the upper band, suggesting bullish momentum.
Overall, the technical analysis of Stitch Fix stock indicates a bullish trend with some buying pressure, but investors should be cautious of potential overbought conditions.
Ratings & Consensus Estimates: The consensus analyst rating on Stitch Fix stock stands at Equal-Weight with a price target of $4.57. The more recent analyst ratings from Telsey Advisory Group, Mizuho and Truist Securities, have an average price target of $3.17, indicating an implied 21.79% upside.
SFIX Price Action: Stitch Fix stock closed at $2.58 on Monday, up 4.45%.