Nike Stock Struggles Ahead Of Q4 Earnings: Can It 'Just Do It' And Overcome Bearish Trend?
Author: Surbhi Jain | June 26, 2024 12:19pm
Nike Inc (NYSE:NKE) will be reporting its fourth-quarter earnings on Thursday. Wall Street expects 7 cents in EPS and $12 billion in revenues as the company reports after market hours.
The stock is down 15.9% over the past year, trading 11.8% lower YTD.
Let’s look at what the charts indicate for Nike stock, and how the stock currently maps against Wall Street estimates.
Nike Stock Technical Setup Ahead Of Q4 Earnings
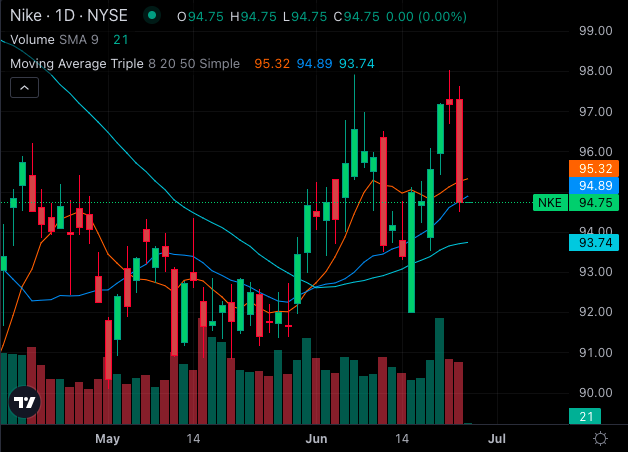
Nike stock is grappling with a strongly bearish trend, as reflected by its position below crucial exponential moving averages.
The current share price of $94.75 sits under the 5, 20, and 50-day exponential moving averages, indicating significant selling pressure and a risk of further bearish movement.
Key technical indicators reinforce this outlook:
8-day SMA: Nike’s share price of $94.75 is below the 8-day simple moving average (SMA) of $95.32, signaling bearishness.
20-day SMA: The stock price at $94.75 compared to the 20-day SMA of $94.89, reinforces the bearishness.
50-day SMA: Interestingly, the 50-day SMA stands at $93.74, slightly lower than the current price, suggesting a bullish trend in this short-term context.
200-day SMA: Nike’s price is significantly below the 200-day SMA of $100.34, reinforcing a long-term bearish signal.
Other technical metrics also support the bearish stance:
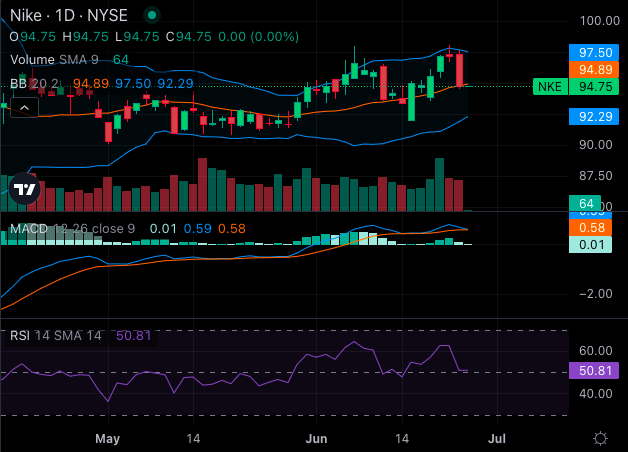
MACD: Despite a MACD indicator of 0.59 suggesting potential bullishness, this is overshadowed by other bearish signals.
RSI: The Relative Strength Index (RSI) is at 50.81, implying the stock is neither overbought nor oversold.
Bollinger Bands: Both the 20-day Bollinger Bands have the current price within the bullish upper band territory.
While the MACD and Bollinger Bands suggest some buying potential, the prevailing bearish indicators, including the SMAs, suggest that Nike stock is under selling pressure, posing a risk for future bearish movement.
Ratings & Consensus Estimates: The consensus analyst rating on Nike stock stands at a Buy currently with a price target of $100.49. Analysts from Telsey, Oppenheimer, and JPMorgan – who recently rated the stock – have a $117 average price target, implying a 23.63% upside.
NKEPrice Action: Nike stock was down 0.95% to $93.89 at the time of publication Wednesday.