Quarter End Window Dressing And Fed's Favorite Inflation Gauge Ahead, Hopes Of Two Rate Cuts In Europe
Author: The Arora Report | June 26, 2024 01:51pm
To gain an edge, this is what you need to know today.

Window Dressing
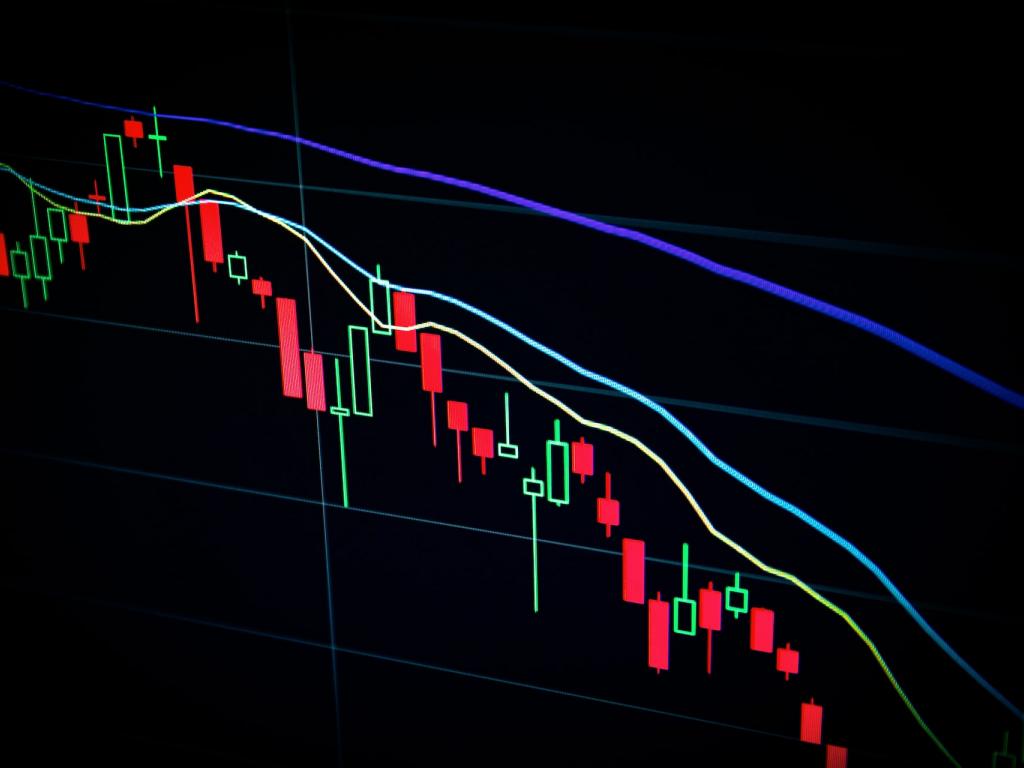
Please click here for an enlarged chart of SPDR S&P 500 ETF Trust (NYSE:SPY) which represents the benchmark stock market index S&P 500 (SPX).
Note the following:
- The chart shows that the stock market has continued to levitate way above the support zone. This indicates that there is significant risk if buying here.
- The chart shows that the volume is low. This indicates lack of conviction.
- RSI on the chart shows that, at least temporarily, the stock market is losing its upward momentum and can pull back.
- This is the end of the quarter. Window dressing is underway. In window dressing, some money managers buy the best performing stocks of the quarter and sell the weakest stocks of the quarter. The purpose is to show their clients in the quarter end reports that they were holding the best performing stocks.
- The Fed's favorite inflation gauge, PCE, will be released on Friday. Economists have become good at correctly predicting PCE. Nonetheless, PCE has the potential to move the market.
- Micron Technology Inc (NASDAQ:MU) will report earnings after the close. MU earnings will impact the artificial intelligence trade. Please see prior Morning Capsules and articles on Micron for more details.
- In noteworthy action, traders have been running up NVIDIA Corp (NASDAQ:NVDA) stock after it touched the top band of the mini support zone. Please click here for the chart. For the sake of complete transparency, this chart has not been changed from the chart published yesterday morning before the market open.
- In the early trade, traders ran up NVDA to $129.97, where selling came in. As of this writing, selling is persisting.
- In noteworthy news, Volkswagen A G Unsponsored Represent 1 10th Sh ADR (OTC:VWAGY) has thrown a lifeline to EV maker Rivian Automotive Inc (NASDAQ:RIVN) with a $1B initial investment and plans to invest up to $5B. As a full disclosure, there is a very nice profitable trade on RIVN in The Arora Report's ZYX Buy.
- Olli Rehn, an ECB policy maker, said that two rate cuts this year are reasonable. In The Arora Report analysis, every ECB meeting this year will be live for a potential rate cut.
- In The Arora Report analysis, ECB actions are going to put pressure on the Fed to cut rates.
- Options traders are betting on interest rate cuts of 3% over the next nine months in the U.S. These options traders belong to the momo crowd. Investors need to be aware that even though they are betting real money, these options traders have been consistently wrong. They started the year betting on six or seven rate cuts this year. For reference, there have been no rate cuts so far this year. If these options traders are right, the Fed would be very aggressively cutting rates this year and early next year.
- As an actionable item, the sum total of the foregoing is in the protection band, which strikes the optimum balance between various crosscurrents. Please scroll down to see the protection band. The protection band is one of the large number of unique edges that are available to members of The Arora Report.
Magnificent Seven Money Flows
In the early trade, money flows are positive in Apple Inc (NASDAQ:AAPL) and Amazon.com, Inc. (NASDAQ:AMZN).
In the early trade, money flows are negative in NVDA, Alphabet Inc Class C (NASDAQ:GOOG), Meta Platforms Inc (NASDAQ:META), Microsoft Corp (NASDAQ:MSFT), and Tesla Inc (NASDAQ:TSLA).
In the early trade, money flows are negative in S&P 500 ETF (SPY) and Invesco QQQ Trust Series 1 (NASDAQ:QQQ).
Momo Crowd And Smart Money In Stocks
Investors can gain an edge by knowing money flows in SPY and QQQ. Investors can get a bigger edge by knowing when smart money is buying stocks, gold, and oil. The most popular ETF for gold is SPDR Gold Trust (NYSE:GLD). The most popular ETF for silver is iShares Silver Trust (NYSE:SLV). The most popular ETF for oil is United States Oil ETF (NYSE:USO).
Bitcoin
Bitcoin (CRYPTO: BTC) is range bound and trading above $60,000.
Protection Band And What To Do Now
It is important for investors to look ahead and not in the rearview mirror.
Consider continuing to hold good, very long term, existing positions. Based on individual risk preference, consider a protection band consisting of cash or Treasury bills or short-term tactical trades as well as short to medium term hedges and short term hedges. This is a good way to protect yourself and participate in the upside at the same time.
You can determine your protection bands by adding cash to hedges. The high band of the protection is appropriate for those who are older or conservative.The low band of the protection is appropriate for those who are younger or aggressive. If you do not hedge, the total cash level should be more than stated above but significantly less than cash plus hedges.
A protection band of 0% would be very bullish and would indicate full investment with 0% in cash. A protection band of 100% would be very bearish and would indicate a need for aggressive protection with cash and hedges or aggressive short selling.
It is worth reminding that you cannot take advantage of new upcoming opportunities if you are not holding enough cash. When adjusting hedge levels, consider adjusting partial stop quantities for stock positions (non ETF); consider using wider stops on remaining quantities and also allowing more room for high beta stocks. High beta stocks are the ones that move more than the market.
Traditional 60/40 Portfolio
Probability based risk reward adjusted for inflation does not favor long duration strategic bond allocation at this time.
Those who want to stick to traditional 60% allocation to stocks and 40% to bonds may consider focusing on only high quality bonds and bonds of seven year duration or less. Those willing to bring sophistication to their investing may consider using bond ETFs as tactical positions and not strategic positions at this time.
The Arora Report is known for its accurate calls. The Arora Report correctly called the big artificial intelligence rally before anyone else, the new bull market of 2023, the bear market of 2022, new stock market highs right after the virus low in 2020, the virus drop in 2020, the DJIA rally to 30,000 when it was trading at 16,000, the start of a mega bull market in 2009, and the financial crash of 2008. Please click here to sign up for a free forever Generate Wealth Newsletter.
This article is from an unpaid external contributor. It does not represent Benzinga's reporting and has not been edited for content or accuracy.
Posted In: $BTC AAPL AMZN GLD GOOG META MSFT MU NVDA QQQ RIVN SLV SPY TSLA USO VWAGY