Last Inflation Report Pushed Markets To Record Highs In June: Could It Happen Again Friday? 5 ETFs To Watch
Author: Piero Cingari | June 27, 2024 04:53pm
The inflation report that’s closely watched by the Federal Reserve — the Personal Consumption Expenditure price index — was published on May 31 for April data and sparked a fresh market rally in June, pushing major indexes to their all-time highs.
As traders brace for Friday’s PCE price index report for May, scheduled for release at 8:30 a.m. ET, many are wondering whether new favorable inflation data could bring the bulls back to Wall Street after some mixed performance in recent sessions.
May’s PCE Report: What Do Economists Expect?
The PCE price index is expected to decrease from 2.7% year-on-year in April to 2.6% in May, according to economist consensus data gathered by Econoday.
On a monthly basis, the index is forecasted to rise at a 0.1% rate, down from the previous 0.3%.
The core PCE price index is projected to drop from 2.8% to 2.6% year-on-year in May, potentially reaching its lowest level since March 2021.
Monthly, it is expected to slow from 0.2% to 0.1%.
If PCE inflation falls as expected or even more, it could bolster investor expectations of rate cuts, potentially reigniting hopes for a move as early as September, and would be welcomed by markets.
Traders are assigning a 65% chance on a Fed rate cut in September. Overall, there are 50 basis points — equivalent to two rate cuts — priced into year-end.
Fed’s Favorite PCE Report Arrives Friday: What Happened Last Time?
In April, the headline PCE inflation rate remained steady at 2.7% year-on-year. The core PCE price index also matched expectations with a 2.8% year-on-year increase, though it came in slightly lower than monthly estimates (0.2% vs. 0.3%).
Data on personal spending and personal income came in slightly softer than predicted, fueling expectations that the economy was cooling down and that inflation pressures would continue to ease.
This sustained expectations of an increasing likelihood of the Fed delivering two rate cuts by the end of the year.
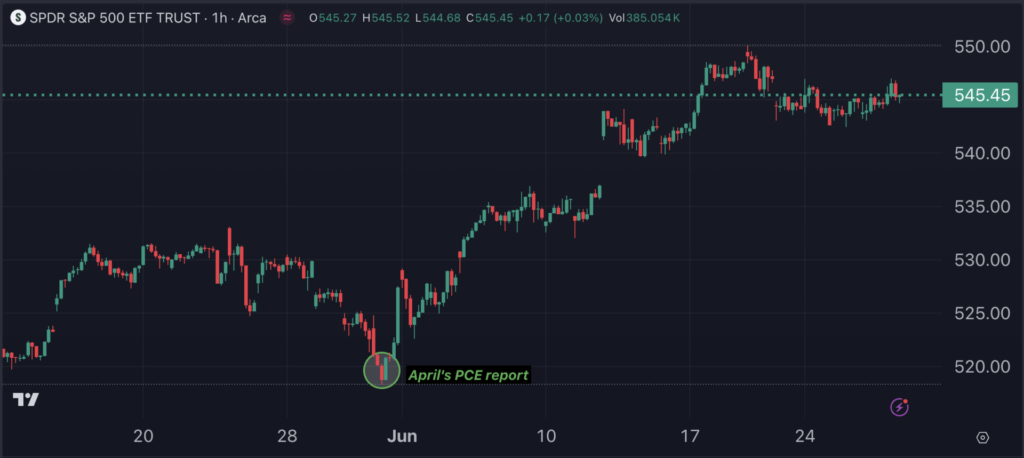
Stocks reacted positively to April’s PCE report. The S&P 500, as tracked by the SPDR S&P 500 (NYSE:SPY), rallied 0.9% on that day.
Notably, the data was a key turning point for a bullish trend reversal in June, as the chart below retrieved from Benzinga Pro shows.
Other Key ETFs To Watch Friday
Other than the broader stock market, traders will also be closely monitoring other key asset classes to gauge the overall market’s reaction to the PCE inflation report, including:
The U.S. Dollar Index: Tracked by the Invesco DB USD Index Bullish Fund ETF (NYSE:UUP). The dollar may weaken if inflation comes in below consensus estimates, and strengthen if it exceeds expectations, in reactions to market interest rate expectations.
Long-dated U.S. Treasury Bonds: Measured by the iShares 20+ Year Treasury Bond ETF (NASDAQ:TLT). A lower-than-expected PCE report is likely to push bond yields down, driving up the value of Treasury-related ETFs, and vice versa.
Gold Prices: Monitored through the SPDR Gold Trust (NYSE:GLD). Gold typically moves inversely to the dollar and yields. A cooler-than-expected PCE report could increase expectations for Fed rate cuts, enhancing gold’s appeal.
The Russell 2000 Index: Replicated by the iShares Russell 2000 ETF (NYSE:IWM). Small caps, which have significantly underperformed the S&P 500 and Nasdaq 100 this year, may benefit from lower inflation rates as the pressure from high interest rates, which affect them more than large-cap stocks, would diminish.