Huge Post Debate Uncertainty For Investors, New Data On Fed's Favorite Inflation Gauge And Personal Spending
Author: The Arora Report | June 28, 2024 11:08am
To gain an edge, this is what you need to know today.

PCE
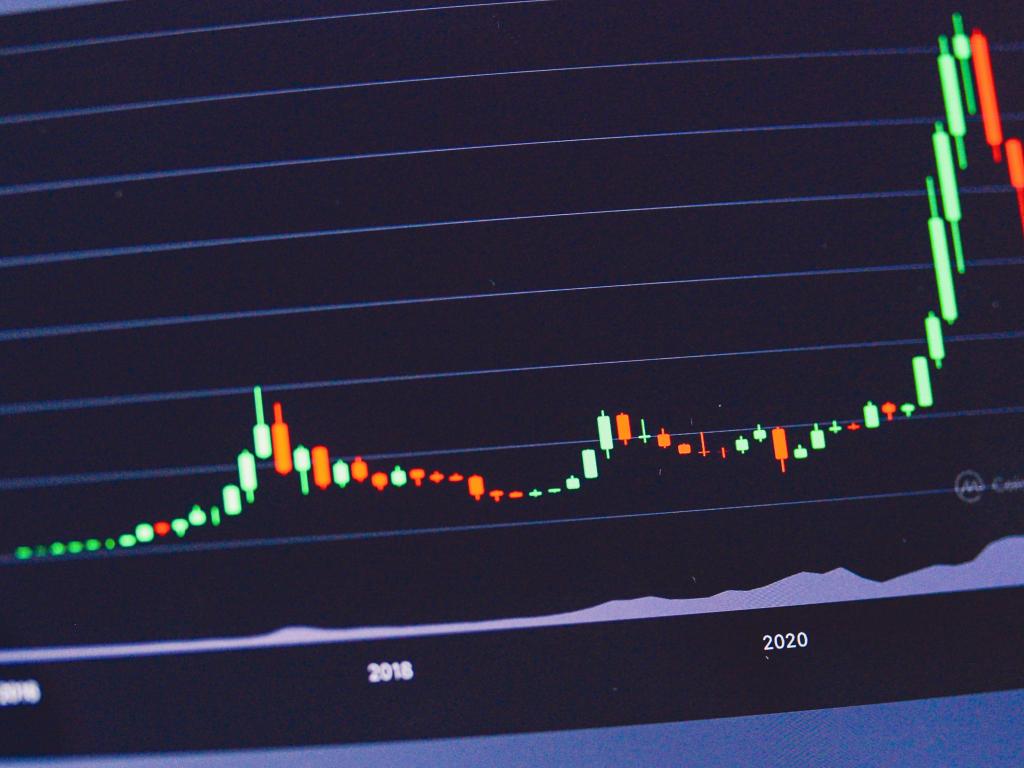
Please click here for an enlarged chart of SPDR S&P 500 ETF Trust (NYSE:SPY) which represents the benchmark stock market index S&P 500 (SPX).
Note the following:
- The chart shows that the stock market is attempting to break to a new high.
- RSI on the chart shows that there is a technical set up for the stock market to go higher.
- The chart shows that the stock market is significantly above the support zone. This indicates that buying here does not have a favorable risk reward ratio.
- The chart shows low volume. This indicates a lack of conviction.
- We previously shared with you that economists have become good at predicting the Fed’s favorite inflation gauge PCE. PCE data came as expected. Here are the details:
- Headline PCE came at 0.0% vs. 0.0% consensus.
- Core PCE came at 0.1% vs. 0.1% consensus.
- The U.S. economy is 70% consumer based. For this reason, prudent investors pay attention to personal income and personal spending. Personal spending dropped. This is inline with the other data of the consumer pulling back that we have been sharing with you. Here are the details:
- Personal spending came at 0.2% vs. 0.3% consensus.
- Personal income came at 0.5% vs. 0.4% consensus.
- First and foremost, The Arora Report is politically agnostic. The Arora Report strives to be objective and rigorously analytical to help investors. To make money in the markets, it is important for investors to separate their political views from investing. Here are the key points:
- The presidential debate has thrown huge uncertainty in the American economy and U.S.’s international standing.
- Prudent investors should wait for the air to clear post debate.
- There will be winning and losing investments from the election.
- Depending upon what happens over the coming days, changes may be made in the portfolios.
- In The Arora Report analysis, if nothing changes, the Magnificent Seven stocks,other mega cap stocks, and fossil fuel energy stocks are the winners post debate; clean energy stocks, environmental stocks, and Chinese stocks are losers; and companies that compete with Chinese companies are the winners.
- In The Arora Report analysis, if nothing changes, the U.S. dollar is a potential loser and gold is a potential winner.
- Quarter end window dressing continues.
- As an actionable item, the sum total of the foregoing is in the protection band, which strikes the optimum balance between various crosscurrents. Please scroll down to see the protection band. The protection band is one of the large number of unique edges that are available to members of The Arora Report.
France
The first round of French elections will take place this weekend. The far right National Rally is projected to make gains. President Macron’s party is projected to lose. There are significant implications from the French elections for investors. Please see prior Capsules for details.
Magnificent Seven Money Flows
In the early trade, money flows are positive in Apple Inc (NASDAQ:AAPL), Amazon.com, Inc. (NASDAQ:AMZN), NVIDIA Corp (NASDAQ:NVDA), and Tesla Inc (NASDAQ:TSLA).
In the early trade, money flows are neutral in Microsoft Corp (NASDAQ:MSFT).
In the early trade, money flows are negative in Alphabet Inc Class C (NASDAQ:GOOG), and Meta Platforms Inc (NASDAQ:META).
In the early trade, money flows are mixed in SPDR S&P 500 ETF Trust (NYSE:SPY) and Invesco QQQ Trust Series 1 (NASDAQ:QQQ).
Momo Crowd And Smart Money In Stocks
Investors can gain an edge by knowing money flows in SPY and QQQ. Investors can get a bigger edge by knowing when smart money is buying stocks, gold, and oil. The most popular ETF for gold is SPDR Gold Trust (NYSE:GLD). The most popular ETF for silver is iShares Silver Trust (NYSE:SLV). The most popular ETF for oil is United States Oil ETF (NYSE:USO).
Bitcoin
Bitcoin (CRYPTO: BTC) is range bound.
Protection Band And What To Do Now
It is important for investors to look ahead and not in the rearview mirror.
Consider continuing to hold good, very long term, existing positions. Based on individual risk preference, consider a protection band consisting of cash or Treasury bills or short-term tactical trades as well as short to medium term hedges and short term hedges. This is a good way to protect yourself and participate in the upside at the same time.
You can determine your protection bands by adding cash to hedges. The high band of the protection is appropriate for those who are older or conservative. The low band of the protection is appropriate for those who are younger or aggressive. If you do not hedge, the total cash level should be more than stated above but significantly less than cash plus hedges.
A protection band of 0% would be very bullish and would indicate full investment with 0% in cash. A protection band of 100% would be very bearish and would indicate a need for aggressive protection with cash and hedges or aggressive short selling.
It is worth reminding that you cannot take advantage of new upcoming opportunities if you are not holding enough cash. When adjusting hedge levels, consider adjusting partial stop quantities for stock positions (non ETF); consider using wider stops on remaining quantities and also allowing more room for high beta stocks. High beta stocks are the ones that move more than the market.
Traditional 60/40 Portfolio
Probability based risk reward adjusted for inflation does not favor long duration strategic bond allocation at this time.
Those who want to stick to traditional 60% allocation to stocks and 40% to bonds may consider focusing on only high quality bonds and bonds of seven year duration or less. Those willing to bring sophistication to their investing may consider using bond ETFs as tactical positions and not strategic positions at this time.
The Arora Report is known for its accurate calls. The Arora Report correctly called the big artificial intelligence rally before anyone else, the new bull market of 2023, the bear market of 2022, new stock market highs right after the virus low in 2020, the virus drop in 2020, the DJIA rally to 30,000 when it was trading at 16,000, the start of a mega bull market in 2009, and the financial crash of 2008. Please click here to sign up for a free forever Generate Wealth Newsletter.
This article is from an unpaid external contributor. It does not represent Benzinga's reporting and has not been edited for content or accuracy.
Posted In: $BTC AAPL AMZN GLD GOOG META MSFT NVDA QQQ SLV SPY TSLA USO