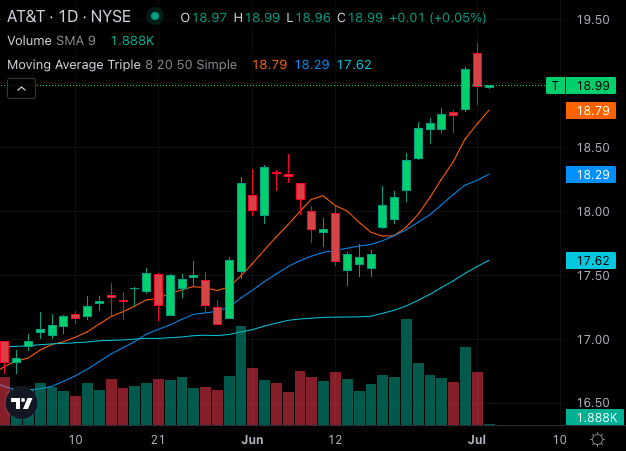
Simple Moving Averages: AT&T’s share price of $18.99 is above its 8-day SMA of $18.79, 20-day SMA of $18.29 and 50-day SMA of $17.62. The 200-day SMA, standing at $16.66, further solidifies the bullish stance. These moving averages collectively indicate continued upward momentum.
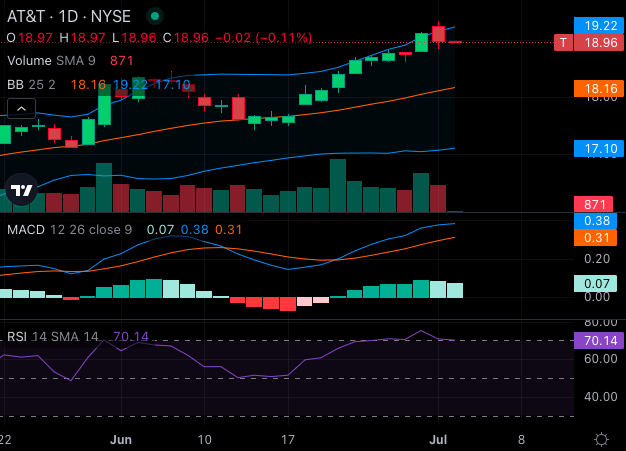
MACD Indicator: The Moving Average Convergence Divergence (MACD) indicator for AT&T is at 0.38, a positive reading that underscores the bullish sentiment. This suggests that the stock is in a healthy uptrend, with the MACD line staying above the signal line.
RSI and Bollinger Bands: The Relative Strength Index (RSI) for AT&T is at 70.14, indicating that the stock is overbought. Despite this, the Bollinger Bands provide additional bullish signals. The 25-day range of $17.10 – $19.22 suggests that the stock is poised for further gains.
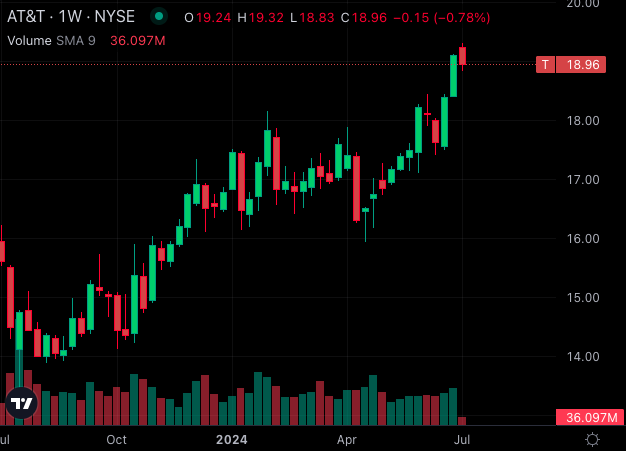
The achievement of a new 52-week high at $19.32 is a significant milestone for AT&T. This high is a technical affirmation of the stock's strength. It indicates strong investor confidence and could attract more buying interest, potentially driving the stock price higher.
Overall, AT&T's technical setup is overwhelmingly bullish. The stock’s performance above key moving averages, positive MACD reading and favorable Bollinger Bands all point towards a continued uptrend. However, with the RSI indicating overbought conditions, investors should remain cautious of potential short-term pullbacks.
Nonetheless, the new 52-week high underscores AT&T’s solid momentum and bullish outlook.