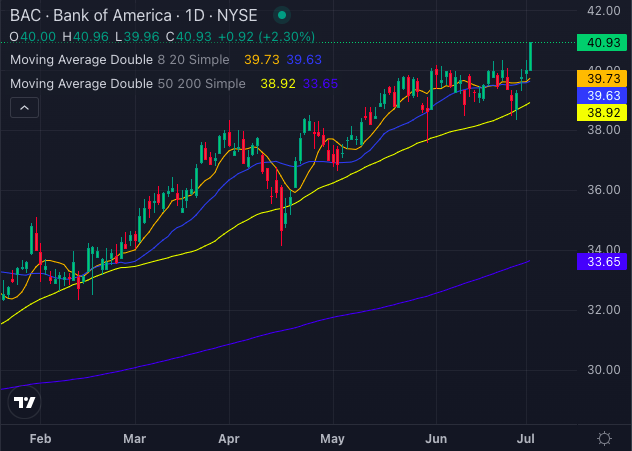
Moving Averages: Bank of America’s share price of $40.93 is above its 5-day, 20-day and 50-day exponential moving averages, indicating strong buying pressure. Specifically, the 8-day SMA is $39.73, the 20-day SMA is $39.63 and the 50-day SMA is $38.92—all pointing to a bullish trend.
Long-Term Indicators: With the stock trading at $40.93, it's comfortably above its 200-day SMA of $33.65, reinforcing the bullish outlook.
Goldman Sachs analyst Richard Ramsden is cautiously optimistic for the second-quarter earnings season, citing a favorable environment of sustained high interest rates that could boost U.S. banks’ profitability.
Ramsden noted that large banks are trading at about 55% of the S&P 500 P/E ratio, compared to a historical average discount of 61%. This discount, coupled with diminishing headwinds and potential upside post-U.S. election, presents an attractive entry point for BAC.
Goldman Sachs remains positive on Bank of America, highlighting its Net Interest Income (NII) trajectory, expected to reaccelerate later in the year.
With Bank of America's technical indicators and analyst outlook aligning on a bullish trajectory, the stock appears poised for continued growth. For investors seeking a strong play in the banking sector, BAC presents a compelling opportunity.