Nio Inc. (NYSE:NIO) has had a rough year, with the stock plunging 51.54% over the past year and 46.31% year-to-date. But the story doesn’t end there. The latest shake-up at the top and mixed technical indicators have made Nio a stock to watch closely.
Leadership Change: CFO Resigns, New CFO Steps Up
Nio’s Chief Financial Officer, Steven Wei Feng, resigned for personal and family reasons, effective Friday. Stepping into the role is Stanley Yu Qu, the company’s senior vice president of Finance. This news sent Nio shares down 2.67% as investors digested the leadership change.
Despite the leadership turmoil, Nio’s electric vehicle (EV) deliveries have been impressive.
In June 2024, Nio delivered 21,209 EVs, a 98.1% year-over-year increase. The second quarter of 2024 saw 57,373 EVs delivered, up a staggering 143.9% year-over-year. As of June 30, 2024, Nio’s cumulative deliveries reached 537,020 vehicles.
Nio Stock – Mixed Technicals Signals
Nio’s technical indicators present a mixed picture:
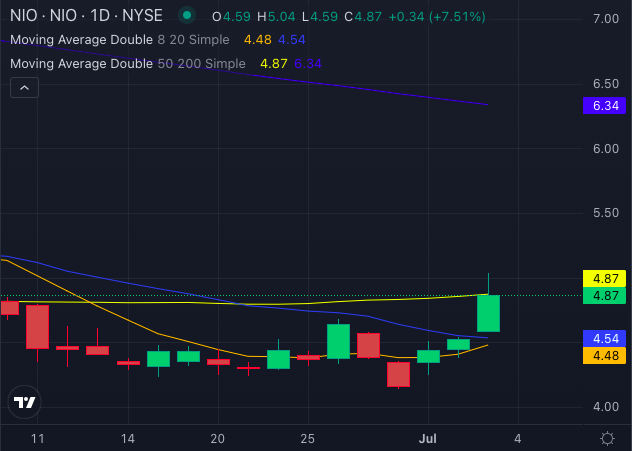
Short-Term Bullish: The stock price of $4.87 is above its 8-day and 20-day simple moving averages (SMAs) of $4.48 and $4.54, respectively, signaling bullish momentum over the short-term.
Long-Term Bearish: The 50-day SMA is also $4.87, making it a neutral signal, while the 200-day SMA is $6.34, indicating long-term bearishness.
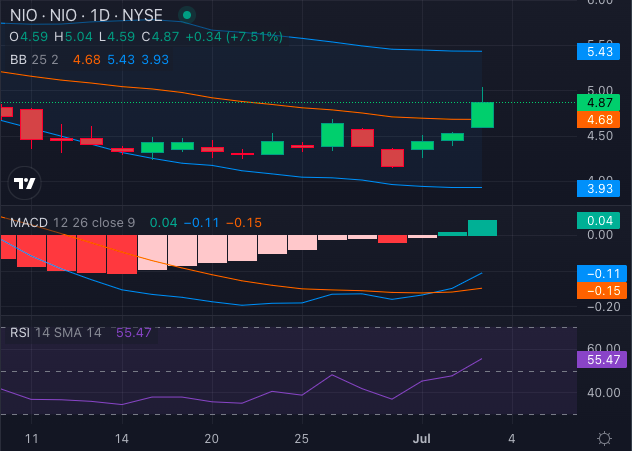
MACD Indicator: With a value of -0.11, the MACD suggests a sell.
Relative Strength Index (RSI): At 55.47, the RSI indicates the stock is neither overbought or oversold.
Bollinger Bands: The 25-day bands (4.3 – 5.06) and 100-day bands (4.37 – 5.65) suggest the stock is a sell.
The Bottom Line
Nio’s impressive EV delivery numbers show strong operational performance, but the leadership change and mixed technical signals add a layer of uncertainty. Investors are advised to stay cautious and watch for further developments as Nio navigates this transitional phase.