Broadcom Gears Up For Stock Split With Clear Bullish Indicators
Author: Surbhi Jain | July 09, 2024 02:40pm
Broadcom Inc. (NASDAQ:AVGO) is gearing up for its highly anticipated 10-for-1 stock split on July 12. Following in the footsteps of recent splits by Nvidia Corp (NASDAQ:NVDA) and Chipotle Mexican Grill (NYSE:CMG), Broadcom aims to make its soaring stock more accessible to a broader range of investors.
Currently trading over $1,700, the stock has surged approximately 500% over the past five years, thanks to increasing demand from artificial intelligence (AI) customers.
In a strategic move to refinance a portion of the loans used for its $69 billion acquisition of VMware Inc., Broadcom recently issued $5 billion in bonds. This move highlights the company’s strong financial standing and strategic planning.
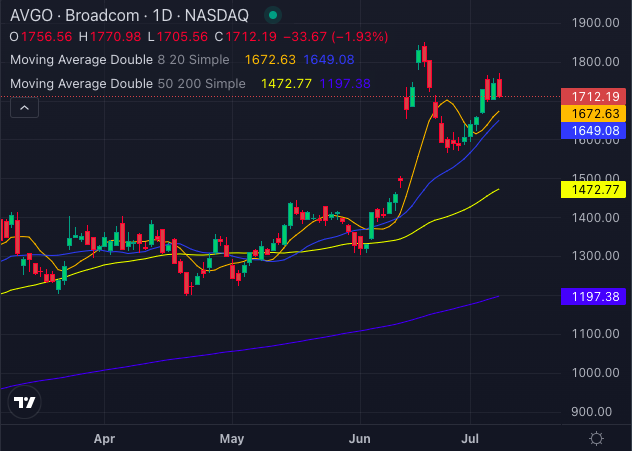
The current share price of $1,712.19 is well above its 5-day, 20-day, and 50-day exponential moving averages, indicating strong buying pressure. The 8-day simple moving average (SMA) is at $1,672.63, while the 20-day SMA stands at $1,649.08, both reinforcing bullish signals with the current price above these levels.
Broadcom’s 50-day SMA is $1,472.77, further validating the bullish sentiment as the current price remains significantly higher. The 200-day SMA is $1,197.38, indicating a long-term positive outlook with the stock price far exceeding this average.
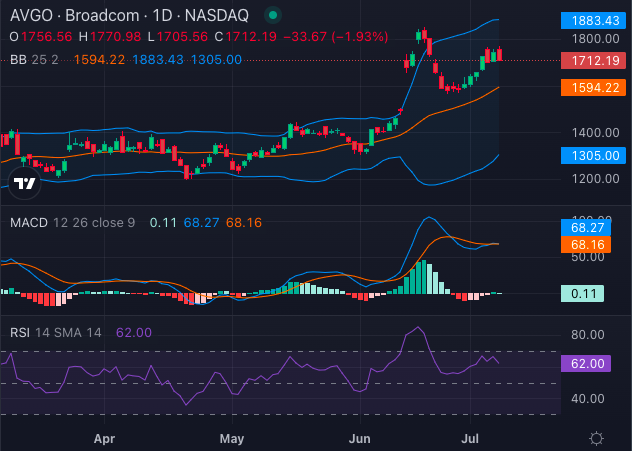
The Moving Average Convergence Divergence (MACD) indicator is at 68.27, suggesting continued bullish momentum. Additionally, the Relative Strength Index (RSI) is 68.27, indicating that while the stock is almost overbought, it remains within a bullish range.
Bollinger Bands analysis also supports a bullish sentiment, with the 25-day bands ranging from $1,305.00 to $1,883.43. The current price lies within the upper (bullish) bands, reinforcing the bullish outlook.
Broadcom’s upcoming stock split, combined with solid technical indicators, positions the company for a potentially strong performance in the coming months. Investors are showing interest in the stock due to its accessibility and potential for future growth.