Palantir Rockets To 52-Week High: What's Fueling The Surge?
Author: Surbhi Jain | July 11, 2024 11:52am
Palantir Technologies Inc. (NYSE:PLTR) hit a new 52-week high of $28.47 during Wednesday’s trading session before dipping about 5% to $26.95 at last check.
Nevertheless, this marks a significant milestone for the data analytics firm. Its stock soared 74.36% over the past year and a staggering 65.52% year-to-date.
AI, Government Contracts Powering Palantir
Driving this bullish momentum is a blend of AI enthusiasm and robust growth in U.S. government business. Palantir’s government contracts, which contribute more than half of its revenue, are re-accelerating, bolstering investor confidence.
The AI wave has also played a crucial role, with Palantir being a major player in the sector.
Palantir Price Chart Points To Strong Bullish Trend
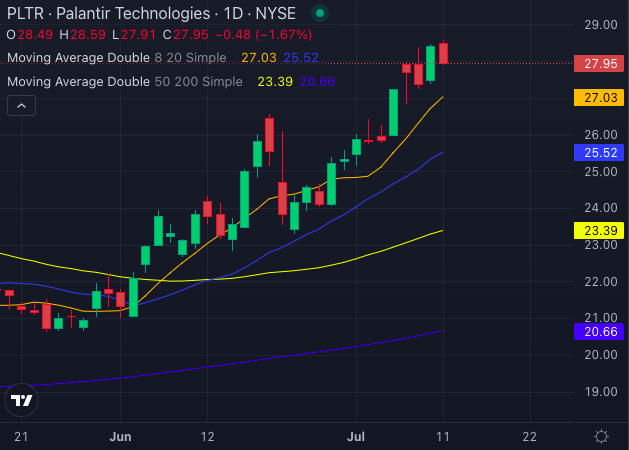
The technical indicators are aligning for Palantir, pointing to a strongly bullish trend. The stock’s current price of $27.95 is well above its 5, 20, and 50-day exponential moving averages, signaling sustained buying pressure. This is a clear positive indicator for future bullish movement.
Palantir's share price compared to its eight-day simple moving average (SMA) of $27.03 reinforces the bullish sentiment among traders.
The stock’s 20-day SMA sits at $25.52, again below the current price, suggesting continued upward momentum. With the 50-day SMA at $23.39, the significant gap to the current price underscores the stock’s bullish trajectory.
Furthermore, Palantir's 200-day SMA is at $20.66, cementing its long-term bullish trend.
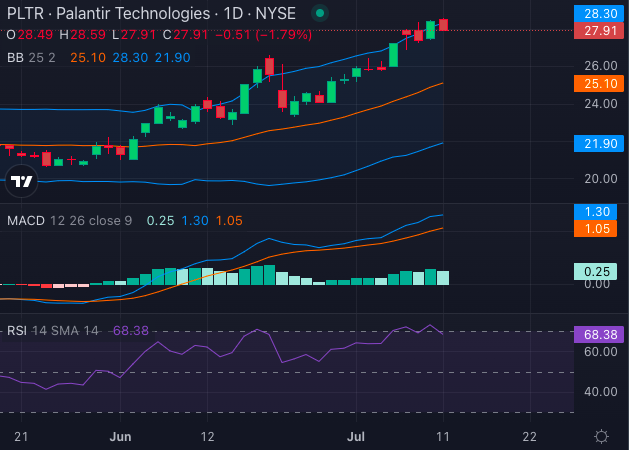
Palantir’s Moving Average Convergence Divergence (MACD) indicator is at 1.30, reinforcing the bullish outlook. The Relative Strength Index (RSI) stands at 68.38, indicating that the stock is almost overbought, which might prompt some caution among investors looking for a pullback. However, the overall sentiment remains positive.
Additionally, the Bollinger Bands provide further bullish signals. The 25-day bands range between $21.90 and $28.30, below the current price of $27.91. This suggests that Palantir is experiencing strong upward momentum.
As Palantir continues to capitalize on AI advancements and secure government contracts, the stock’s bullish trend appears set to continue. Investors should keep an eye on these technical indicators, as they provide valuable insights into the stock’s future performance.
Palantir’s surge to a new 52-week high is backed by strong fundamentals and technical indicators. With AI and government business driving growth, and multiple buy signals from moving averages and MACD, Palantir remains a hot stock to watch.