Stock Of The Day: NVIDIA Has Another Bearish Engulfing Pattern
Author: Mark Putrino | July 12, 2024 12:36pm
The last time a “bearish engulfing pattern” formed on the chart of NVIDIA Corp (NASDAQ:NVDA) a large move lower followed. Now another one of these patterns has formed — and it may also mean a move lower is coming.
Many technical analysts attempt to identify chart patterns without understanding the price action that creates them. That's why Nvidiais our trading team's Stock of the Day.
The chart illustrates two important technical analysis lessons.
Reversals in markets happen when the leadership changes from bulls to bears or bears to bulls. If the change is slow and gradual, a “rounded top” or “rounded bottom” pattern may appear on the chart. If the change takes place over a couple of sessions, it may form a “V top” or “inverted V bottom” pattern.
And when the change in leadership takes place in just one day, an “engulfing pattern” may appear.
Bearish Pattern for Nvidia
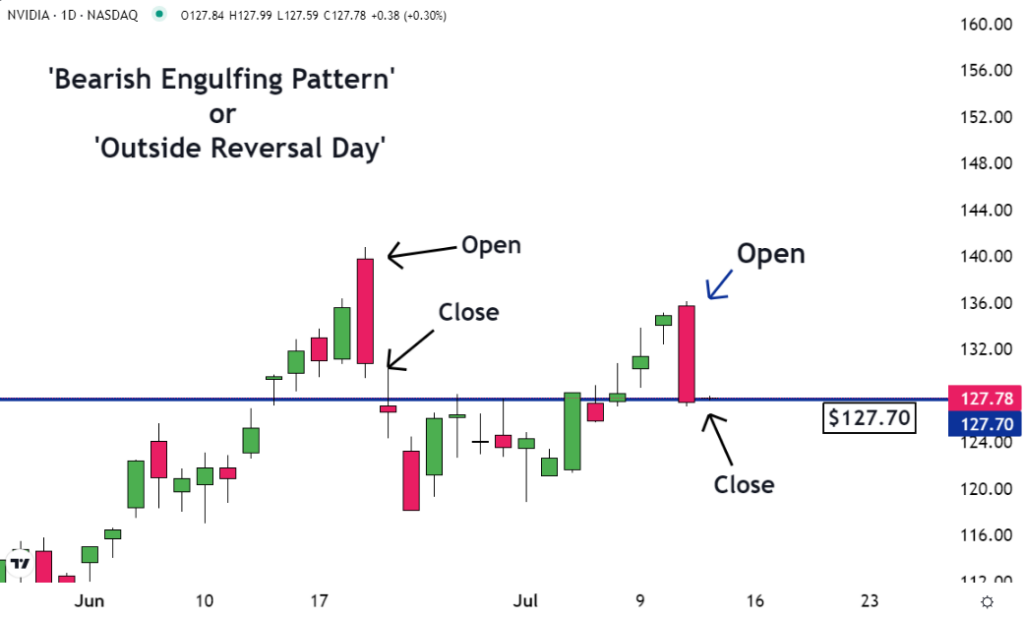
The important thing about this bearish engulfing pattern for Nvidia is the price action that caused it to form. In the morning it looked like it was going to be another up day. The opening price was higher than the previous day's close. It looked like the uptrend was going to continue.
But by the end of the day, something important happened. The sellers overpowered the buyers. They even pushed the price below the previous day's opening price.
The open was higher than the previous close, and the close was lower than the previous open. The price action “engulfed” the prior day's action.
Most volume trades on the open and the close. Because of this there, is typically support at these levels. The fact that the stock fell right through them shows the sellers are extremely aggressive.
As you can see, after yesterday's sell-off, the shares closed just below $128.00. This isn't a coincidence. There is support here for Nvidia because these levels were previously resistance.
Many traders who sold while the shares were at the resistance decided they made a mistake when the price moved higher. Some of them decided to buy their shares back if they could get them for the same price that they were sold for.
As a result, now that the price has fallen back to these levels, buy orders are placed. And if there are enough of these orders, it will create support at what had been resistance.
To understand technical analysis, traders need to understand what chart patterns are. More importantly, they need to understand the price action that creates them.
The image was created using artificial intelligence by MidJourney.