Trump Media Stock Soars 27%, But Bearish Signals Loom
Author: Surbhi Jain | July 15, 2024 11:51am
Trump Media & Technology Group Corp. (NASDAQ:DJT) shares have ignited, surging 27% on Monday morning.
This sharp rise follows a dramatic weekend event at an election rally in Pennsylvania, where former President Donald Trump narrowly escaped an assassination attempt. Following the incident, investor enthusiasm for Trump Media, which owns the Truth Social platform, appears to have increased amid heightened speculation about Trump’s prospects in the upcoming election.
Despite the rally, technical indicators present a more nuanced picture for DJT. Here's a breakdown:
Bullish Momentum Infused Into Trump Media Stock, Oscillators Spell Caution
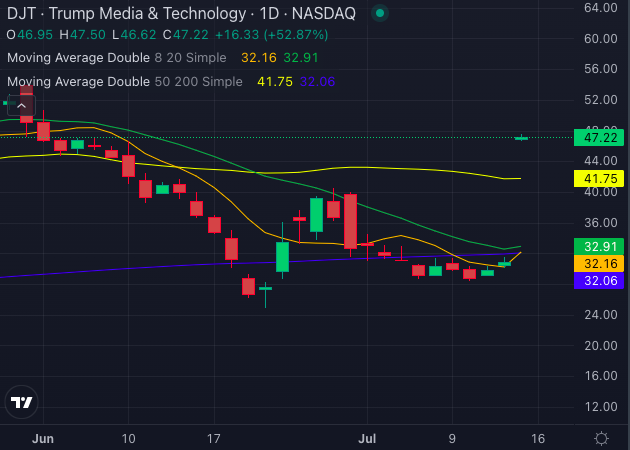
Trump media stock price has risen above its 5, 20, and 50-day exponential moving averages (EMAs), indicating a strongly bearish trend with strong buying pressure evident as Trump’s winning odds strengthen.
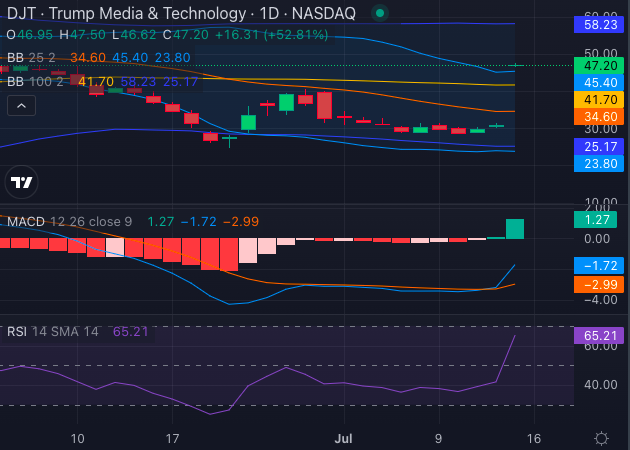
MACD Indicator: The Moving Average Convergence Divergence (MACD) indicator stands at -1.72, suggesting bearish momentum.
RSI Indicator: The Relative Strength Index (RSI) is at 65.21, indicating that the stock is approaching overbought conditions, which might suggest a potential selling opportunity if momentum changes.
Bollinger Bands:
25-period: The bands range between $23.80 and $45.40, with the stock trading in the lower band – suggesting the stock is currently in a bearish zone.
100-period: The bands range between $25.17 and $58.23, further indicating a bearish signal.
The recent news has increased attention to Trump Media's stock, to the extent that the technical indicators have turned mixed. However, while the momentum indicators are signaling bullishness, driven by the recent surge, the oscillators continue to send out bearish signals.
Investors should be mindful of the bearish signals dominating the technical landscape, despite the recent bullish price action.