Stock Of The Day: How To Predict Thermo Fisher Scientific Trend Reversals
Author: Mark Putrino | July 15, 2024 02:14pm
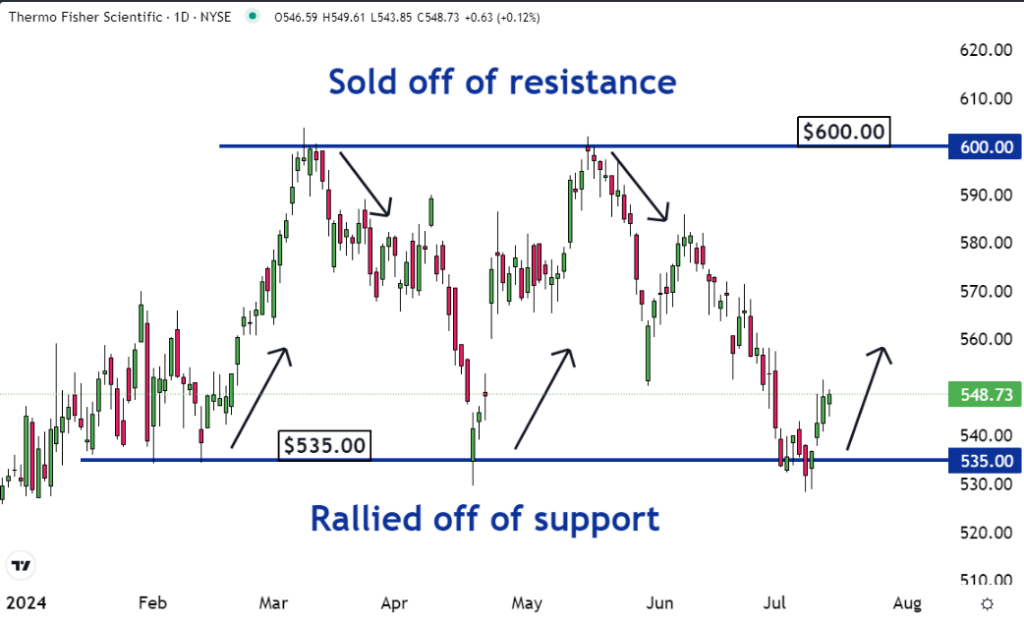
Stocks tend to sell off after they reach resistance. They also tend to rally off of support. These dynamics can be seen on the chart of Thermo Fisher Scientific Inc. (NYSE:TMO). This is why our trading team has selected it as our Stock of the Day.
Resistance is a large group or concentration of sellers who are looking to sell at, or close to, the same price. In the case of Thermo, there has been well-defined resistance around $600.00.
Sometimes, when a stock reaches a resistance level, some of the traders and investors who want to sell become concerned. They can sense that other sellers coming into the market. And they know that the buyers will go to whoever is willing to sell at the lowest price.
So they reduce the prices they are willing to sell at. For example, maybe someone initially wanted to sell at $600.00, but they decide to reduce their price to $599.00.
Other concerned sellers see this and decide to reduce their selling prices as well. It causes a snowball effect as they undercut each other. This could result in a snowball effect which pushes the price lower.
The opposite is true when stocks rally off of support.
Support is a large concentration or group of traders and investors who wish to buy at, or close to, the same price. There has been well-defined support for Thermo around the $535.00 level.
Sometimes, when a stock drops to a support level some of the traders and investors who want to buy become concerned. They can sense that other buyers coming into the market. And they know that the sellers will go to the buyer who is willing to pay the highest price.
As a result, they decide to increase the prices they are willing to pay. For example, maybe someone initially wanted to buy at $535.00, but they decide to increase their price to $536.00. Other concerned buyers see this and do the same.
It could result in a bidding war and snowball effect that forces the shares into an uptrend.
Traders need to understand the dynamics that can make a stock reverse after it reaches a resistance level or drops to a support level. This will give them low-risk trading opportunities.