Can Tesla Q2 Earnings Spark A Golden Cross? Here's What The Charts Indicate
Author: Surbhi Jain | July 22, 2024 08:56am
Wall Street expects Tesla Inc (NASDAQ:TSLA) to report 60 cents in earnings per share and $24.2 billion in revenues when the electric vehicle company releases second-quarter earnings on Tuesday, July 23, after market hours.
The stock is down 17.87% over the past year; it’s also down 3.73% year-to-date.
Let’s look at what the charts indicate for Tesla stock, and how the stock currently maps against Wall Street estimates.
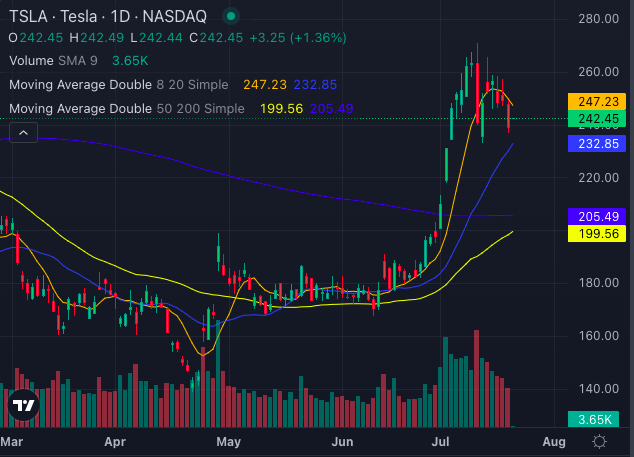
TSLA’s share price stands at $242.45, with mixed signals from various moving averages. The eight-day simple moving average (SMA) at $247.23 generates a bearish signal, while the 20-day SMA at $232.85, the 50-day SMA at $199.56, and the 200-day SMA at $205.49 all indicate bullish signals.
Will Tesla Stock Form A Golden Cross?
Interesting to note here, that the 50-day SMA can be seen (in chart above) moving upwards towards the downward-sloping 200-day SMA, seemingly heading towards a classic Golden Cross situation — considered a massive bull signal for any stock. A Golden Cross occurs when the 50-day SMA cuts above the 200-day SMA (from below).
A Q2 earnings beat, in such a situation, could certainly provide fuel to the current momentum, leading to the Golden Cross being achieved.
The Moving Average Convergence Divergence (MACD) indicator is at 15.43, suggesting bullishness. However, the MACD line has recently crossed under the signal line which could imply future bearishness for Tesla stock. The Relative Strength Index (RSI) is 60.20, has the stock recently retracting from the overbought territory.
The Bollinger Bands (25) range from $161.47 to $284.28 indicates bullishness as well with Tesla stock trading in the upper band. However, it can seen as reversing its trend and heading towards the lower bearish band.
Despite the mixed signals, the overall technical outlook leans toward a cautiously optimistic stance on Tesla’s stock.
Analysts See Some Upside
Ratings & Consensus Estimates: The consensus analyst rating on Tesla stock stands at a Neutral currently with a price target of $191.89. However, Morgan Stanley, Barclays, and Cantor Fitzgerald released their latest analyst ratings for Tesla stock on July 18 and 17, 2024. The average price target from these firms is $255, suggesting a 5.19% upside for Tesla.
TSLAPrice Action: Tesla stock closed the trading day Friday at $239.20, down 4.02%.