Stock Of The Day: Pfizer Pattern Offers Lessons After Better-Than-Expected Q2 Results
Author: Mark Putrino | July 30, 2024 12:35pm
Like many things on Wall Street, technical analysis is widely misunderstood. Many analysts try to identify chart patterns without understanding the psychology and price action that creates them. This is unfortunate because if applied correctly, the analysis can generate profits.
The chart of Pfizer Inc. (NYSE:PFE) offers some important lessons. That's why we have named it our Stock of the Day.
A common principle in technical analysis is that some price levels have more importance than others. These are called support and resistance levels. Another common principle is that price levels that were resistance can turn into support levels. This happens because of remorseful sellers.
People sell, and if the price eventually moves higher many of them regret their decision to do so. Some of them vow to buy their shares back. But they will only do so if they can buy them for the same price they were sold at.
As a result, if the stock falls back to this price they place buy orders. If there are enough of these orders it will form support at the level that had been resistance.
Technical analysis has a fractal nature. The same patterns and dynamics can be seen on charts of different time horizons. This happens because the patterns and dynamics are illustrations of the psychology of traders and investors who have strategies with different time horizons.
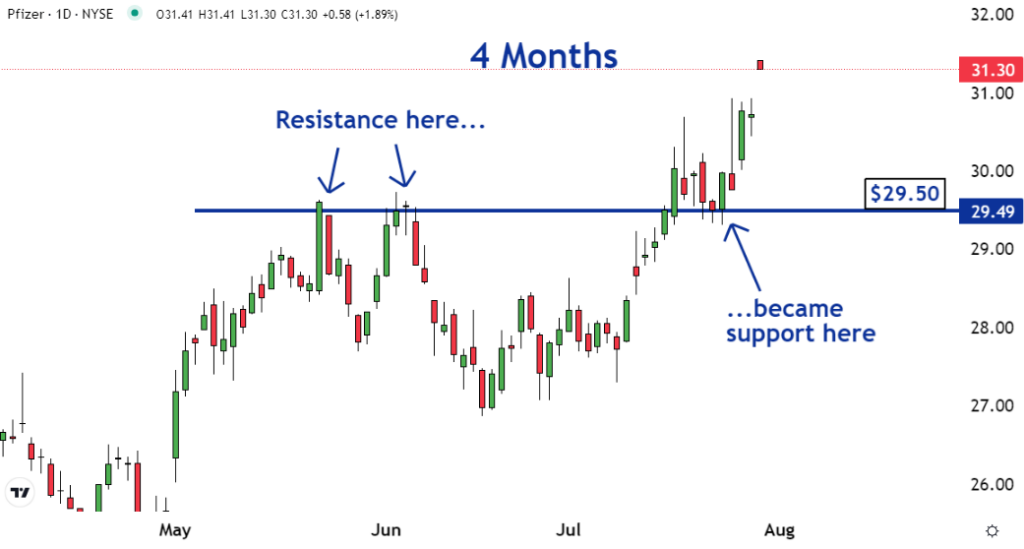
As you can see on the four-month chart of Pfizer, the $29.50 level was resistance in May and June. After this resistance was broken the level converted into a support level. This is a graphical illustration of the seller's remorse of swing traders. They typically have a time horizon of a few weeks or months.
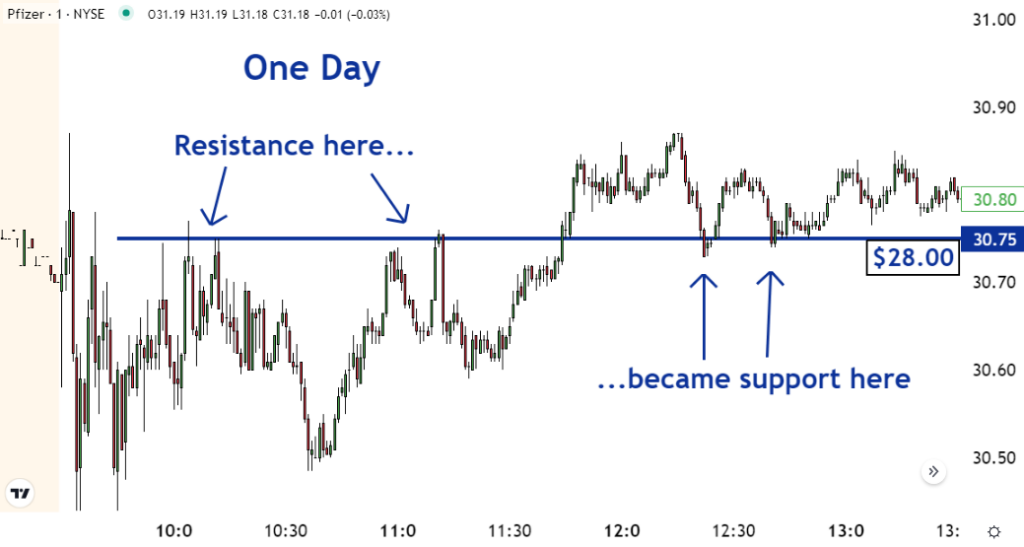
The same price action can be seen on a one-day chart. This is an illustration of the psychology of traders who have short-term horizons. These are the scalpers and day traders.
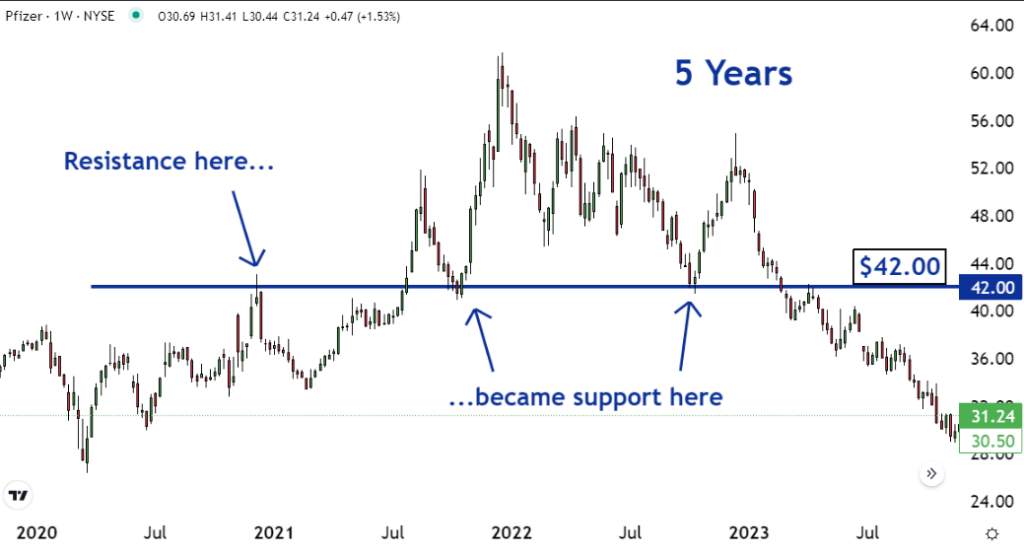
Similar actions can also be seen on a five-year chart. This is an illustration of the psychology of long-term buy and hold investors.
Some of them sold in December of 2020 around the $42.00 level. And for a few months, they thought they made a good decision because the shares trended lower.
Then in July 2021, the stock moved above this price. Many of these investors then became remorseful. They decided to buy their shares back at their selling price. So, when they finally did in October 2022, their buy orders created support.
If understood and applied correctly, technical analysis is a study of market psychology. The same dynamics can be seen on charts with different timeframes. They are graphical illustrations of the psychology of traders and investors who are using strategies with different time horizons.