Stock Of The Day: Will Boeing Earnings Drive Stock Higher?
Author: Mark Putrino | July 31, 2024 12:39pm
The Boeing Company (NYSE:BA) reported earnings that were well short of estimates. But the stock has moved higher and may continue to do so.
The stock has formed a classic ‘Ascending Triangle' on the chart. These patterns are typically reliable and have bullish implications. This is why our team of expert traders has made it our Stock of the Day.
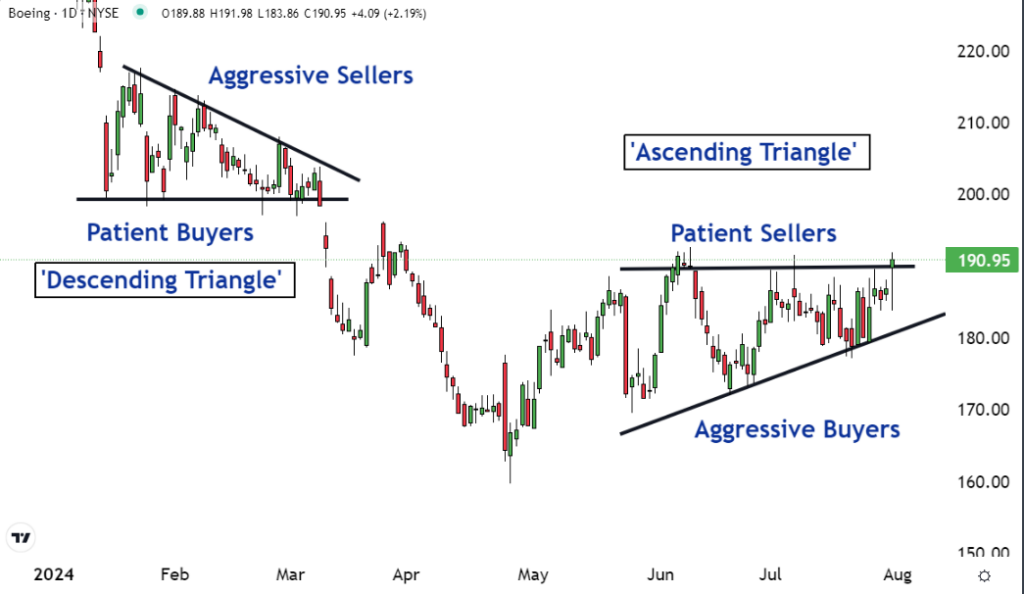
Chart patterns are graphical illustrations of trader and investor psychology. The ascending triangle shows that as time has passed buyers have become increasingly aggressive. They have been willing to pay higher prices. This can be seen on the chart with the ascending support line at the bottom of the pattern.
Market trends do not go in straight lines. They form a series of peaks and valleys. When the valley forms at a higher level than the previous one, it is called a ‘lower high'.
This action occurs because as time passes buyers are willing to pay successively higher prices. As you can see on the chart, when the pattern first started to form in early June the bottom formed around the $170.00 level.
The bottom that formed in late June was around the $175.00 level. And the most recent low occurred around the $180.00 level.
The top part of the pattern is a horizontal resistance level. This is an indication of patient sellers.
They have been willing to stay at their prices and let the buyers come to them. Since early June, they have been complacent and stayed around the $190.00 level.
The ascending triangle pattern is a graphical illustration of aggressive buyers and complacent sellers. These dynamics can set the stage for a move higher.
As you can also see on the chart, earlier this year a classic ‘Descending Triangle' formed on the chart. This has the opposite implications of the ascending triangle. It is a graphical illustration of aggressive sellers and patient buyers.
As time passed after the patterns first began to form, the sellers were willing to accept lower prices. But over the same period, the buyers were patient. They were willing to stay around the $200.00 level. Aggressive sellers and patient buyers could lead to a move lower, and that is what happened here.
Ascending and descending triangles tend to be reliable patterns. The ascending triangle that has formed on the chart of Boeing suggests a move higher may be coming.