Berkshire Hathaway Earnings Preview: Can Warren Buffett's Company Maintain Bullish Momentum?
Author: Surbhi Jain | August 02, 2024 03:57pm
Berkshire Hathaway (NYSE:BRK) (NYSE:BRK) will be reporting its second-quarter earnings on Saturday. Wall Street expects $4.61 in EPS and $81.88 billion in revenues.
The stock is up 21% over the past year, and has risen 18% YTD.
Warren Buffett‘s Berkshire Hathaway has been reducing its stake in Bank of America Corp (NYSE:BAC), selling shares worth $3.8 billion since mid-July. Between July 30 and Aug. 1, the conglomerate reaped $779 million from selling Bank of America stock, according to a recent regulatory filing.
Despite these sales, Berkshire still holds over 942 million shares of the bank, valued at $37.2 billion.
Let’s look at what the charts indicate for Berkshire Hathaway stock, and how the stock currently maps against Wall Street estimates.
Berkshire Hathaway Stock’s Trend Ahead Of Q2 Earnings
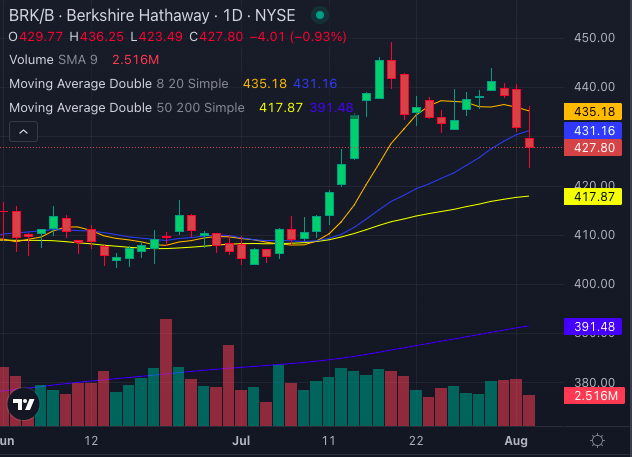
Berkshire Hathaway stock is currently exhibiting a moderately bearish trend with bullish potential, with its share price of $427.80 facing selling pressure.
This is reflected in the 8-day simple moving average (SMA) of $435.18, which signals a bearish outlook. However, the 20-day SMA at $431.16, the 50-day SMA at $417.87, and the 200-day SMA at $391.48 suggest a bullish trend.
These longer-term SMA indicators imply that the stock could be undervalued despite the short-term bearish signals.
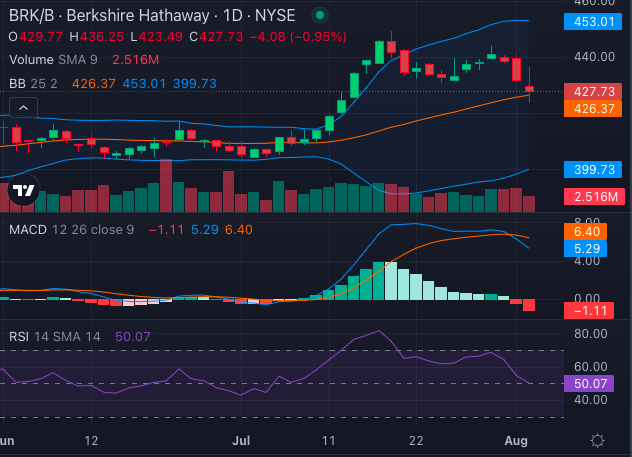
The Moving Average Convergence Divergence (MACD) indicator, at 5.29, supports a bullish stance, indicating potential for upward momentum. On the other hand, the Relative Strength Index (RSI) at 50.07 and declining, suggests that Berkshire Hathaway may be heading towards being oversold, hinting at possible price corrections in the near term.
The Bollinger Bands, with a range between $399.73 and $453.01, further reinforce the bullish outlook, with the stock trading in the upper bullish band.
Overall, while the technical indicators predominantly signal bullish potential, the overbought RSI suggests caution and the possibility of short-term volatility.
Price Action: Berkshire Hathaway stock was down 1.06% at $427.30 at the time of publication Friday.