Stock Of The Day: Is Trump Media Stock About To Breakdown?
Author: Mark Putrino | August 12, 2024 12:50pm
If understood and applied correctly, technical analysis is a study of supply and demand and market psychology. Classic chart patterns are graphical illustrations of these dynamics.
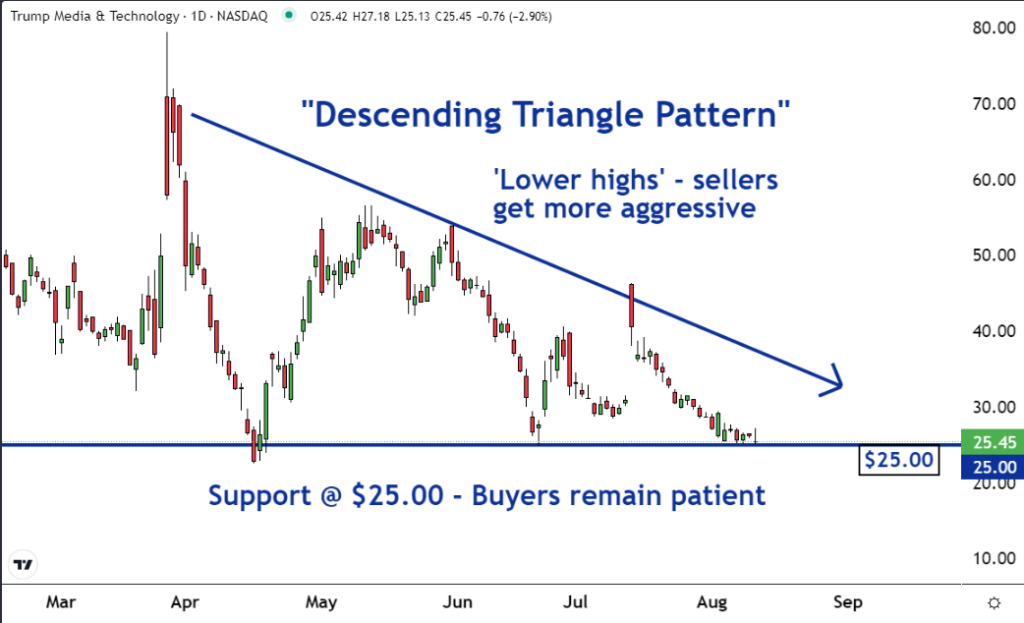
For example, a ‘descending triangle' has formed on the chart of Trump Media & Technology Group Corp. (NASDAQ:DJT). This pattern typically has bearish implications and suggests that the price is about to move lower. This is why our team of expert traders and technical analysts have made it our ‘Stock of the Day'.
A descending triangle shows that as time passes, buyers remain patient while sellers become increasingly aggressive. Regardless of the market, aggressive sellers and complacent or patient buyers can set the stage for a move South.
As you can see on the chart, the $25 level has been support for DJT since April. Each time the shares dropped to this price, buyers put a floor under it. This means that these buyers were willing to be patient and let the sellers come to them.
The horizontal support line is an illustration of patient or complacent buyers.
As you can also see on the chart, the resistance line has been declining or descending since late March. This line illustrates a series of ‘lower highs'.
It shows that as time has passed, the sellers have become increasingly aggressive. They have been willing to accept successively lower prices for their shares.
The descending resistance line is an illustration of aggressive sellers
When a stock reaches a support level, as DJT has done, traders and investors become curious as to whether the support will break and the shares will head lower, or if the support will hold and the shares will reverse and rally.
When there is a descending triangle pattern or series of lower highs in a trend before a stock reaches support, there is a good chance that the support breaks. The aggressive sellers will overpower the patient buyers. This will force the price lower.
There is a good chance that shares of DJT are about to enter a new downtrend.